Immigrants from Canada vs Dutch Single Male Poverty
COMPARE
Immigrants from Canada
Dutch
Single Male Poverty
Single Male Poverty Comparison
Immigrants from Canada
Dutch
12.8%
SINGLE MALE POVERTY
44.8/ 100
METRIC RATING
177th/ 347
METRIC RANK
14.1%
SINGLE MALE POVERTY
0.1/ 100
METRIC RATING
276th/ 347
METRIC RANK
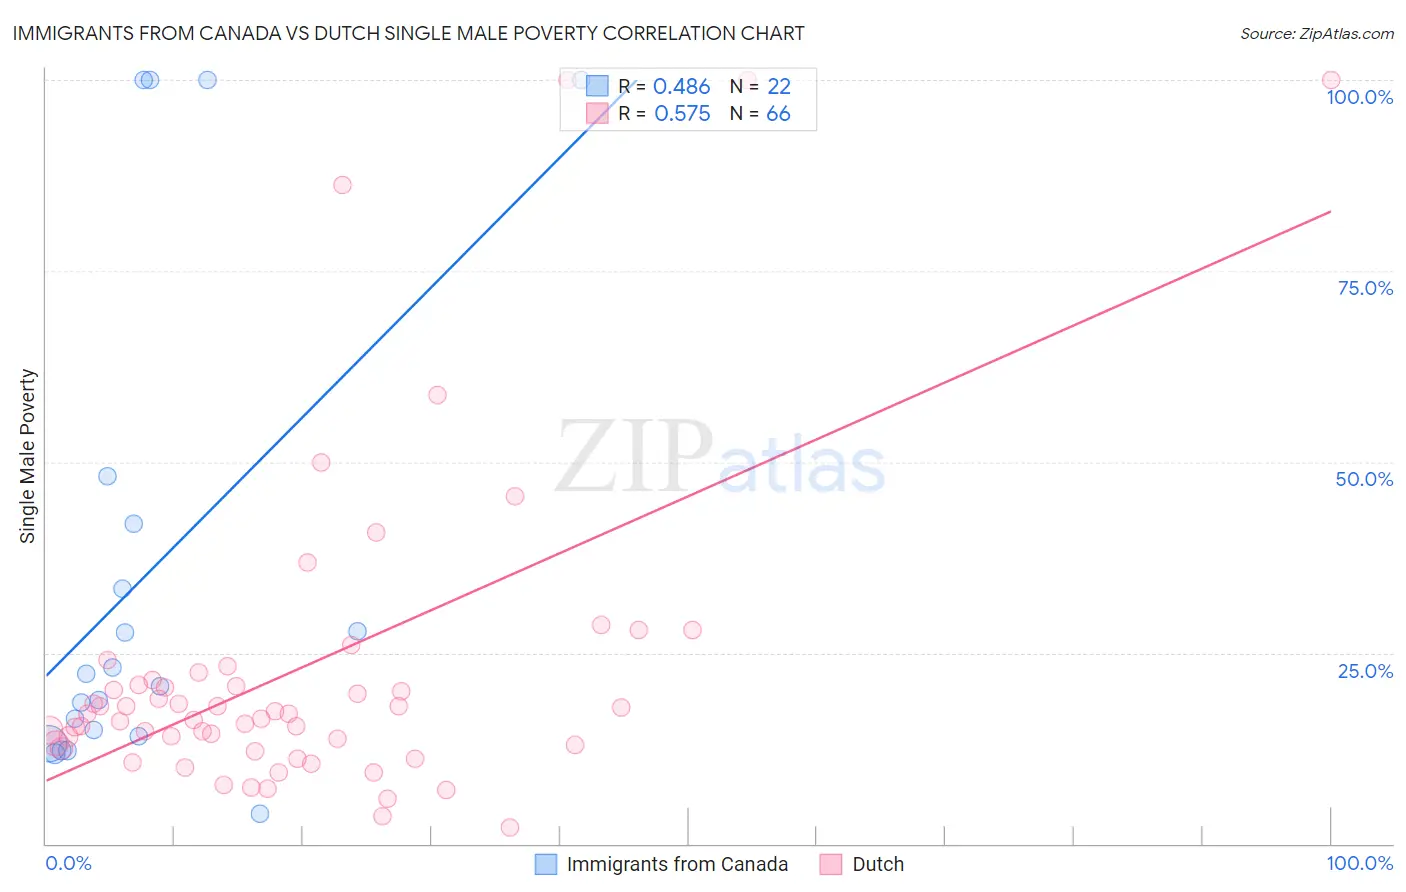
Immigrants from Canada vs Dutch Single Male Poverty Correlation Chart
The statistical analysis conducted on geographies consisting of 395,473,582 people shows a moderate positive correlation between the proportion of Immigrants from Canada and poverty level among single males in the United States with a correlation coefficient (R) of 0.486 and weighted average of 12.8%. Similarly, the statistical analysis conducted on geographies consisting of 460,167,982 people shows a substantial positive correlation between the proportion of Dutch and poverty level among single males in the United States with a correlation coefficient (R) of 0.575 and weighted average of 14.1%, a difference of 9.7%.
Single Male Poverty Correlation Summary
| Measurement | Immigrants from Canada | Dutch |
| Minimum | 4.0% | 2.1% |
| Maximum | 100.0% | 100.0% |
| Range | 96.0% | 97.9% |
| Mean | 35.5% | 22.9% |
| Median | 21.5% | 17.0% |
| Interquartile 25% (IQ1) | 14.1% | 12.8% |
| Interquartile 75% (IQ3) | 41.9% | 21.5% |
| Interquartile Range (IQR) | 27.8% | 8.6% |
| Standard Deviation (Sample) | 32.7% | 21.4% |
| Standard Deviation (Population) | 32.0% | 21.2% |
Similar Demographics by Single Male Poverty
Demographics Similar to Immigrants from Canada by Single Male Poverty
In terms of single male poverty, the demographic groups most similar to Immigrants from Canada are Immigrants from Switzerland (12.8%, a difference of 0.090%), Syrian (12.8%, a difference of 0.19%), Israeli (12.9%, a difference of 0.20%), Croatian (12.8%, a difference of 0.22%), and Costa Rican (12.8%, a difference of 0.28%).
| Demographics | Rating | Rank | Single Male Poverty |
| Guyanese | 52.0 /100 | #170 | Average 12.8% |
| South Africans | 51.5 /100 | #171 | Average 12.8% |
| Danes | 51.4 /100 | #172 | Average 12.8% |
| Immigrants | St. Vincent and the Grenadines | 50.9 /100 | #173 | Average 12.8% |
| Costa Ricans | 50.0 /100 | #174 | Average 12.8% |
| Croatians | 48.9 /100 | #175 | Average 12.8% |
| Syrians | 48.4 /100 | #176 | Average 12.8% |
| Immigrants | Canada | 44.8 /100 | #177 | Average 12.8% |
| Immigrants | Switzerland | 43.1 /100 | #178 | Average 12.8% |
| Israelis | 41.0 /100 | #179 | Average 12.9% |
| Immigrants | North America | 37.7 /100 | #180 | Fair 12.9% |
| Panamanians | 37.6 /100 | #181 | Fair 12.9% |
| Moroccans | 36.8 /100 | #182 | Fair 12.9% |
| Immigrants | West Indies | 33.0 /100 | #183 | Fair 12.9% |
| Immigrants | Trinidad and Tobago | 32.5 /100 | #184 | Fair 12.9% |
Demographics Similar to Dutch by Single Male Poverty
In terms of single male poverty, the demographic groups most similar to Dutch are Immigrants from Honduras (14.1%, a difference of 0.040%), Slovak (14.1%, a difference of 0.10%), English (14.1%, a difference of 0.12%), Indonesian (14.1%, a difference of 0.14%), and Honduran (14.0%, a difference of 0.19%).
| Demographics | Rating | Rank | Single Male Poverty |
| Scottish | 0.1 /100 | #269 | Tragic 14.0% |
| Immigrants | Saudi Arabia | 0.1 /100 | #270 | Tragic 14.0% |
| Irish | 0.1 /100 | #271 | Tragic 14.0% |
| Mexicans | 0.1 /100 | #272 | Tragic 14.0% |
| Welsh | 0.1 /100 | #273 | Tragic 14.0% |
| Hondurans | 0.1 /100 | #274 | Tragic 14.0% |
| English | 0.1 /100 | #275 | Tragic 14.1% |
| Dutch | 0.1 /100 | #276 | Tragic 14.1% |
| Immigrants | Honduras | 0.0 /100 | #277 | Tragic 14.1% |
| Slovaks | 0.0 /100 | #278 | Tragic 14.1% |
| Indonesians | 0.0 /100 | #279 | Tragic 14.1% |
| Hmong | 0.0 /100 | #280 | Tragic 14.2% |
| Hispanics or Latinos | 0.0 /100 | #281 | Tragic 14.2% |
| Spanish Americans | 0.0 /100 | #282 | Tragic 14.2% |
| Yaqui | 0.0 /100 | #283 | Tragic 14.2% |