Celtic vs Eastern European Seniors Poverty Over the Age of 65
COMPARE
Celtic
Eastern European
Seniors Poverty Over the Age of 65
Seniors Poverty Over the Age of 65 Comparison
Celtics
Eastern Europeans
9.8%
SENIORS POVERTY OVER THE AGE OF 65
99.0/ 100
METRIC RATING
60th/ 347
METRIC RANK
9.6%
SENIORS POVERTY OVER THE AGE OF 65
99.6/ 100
METRIC RATING
43rd/ 347
METRIC RANK
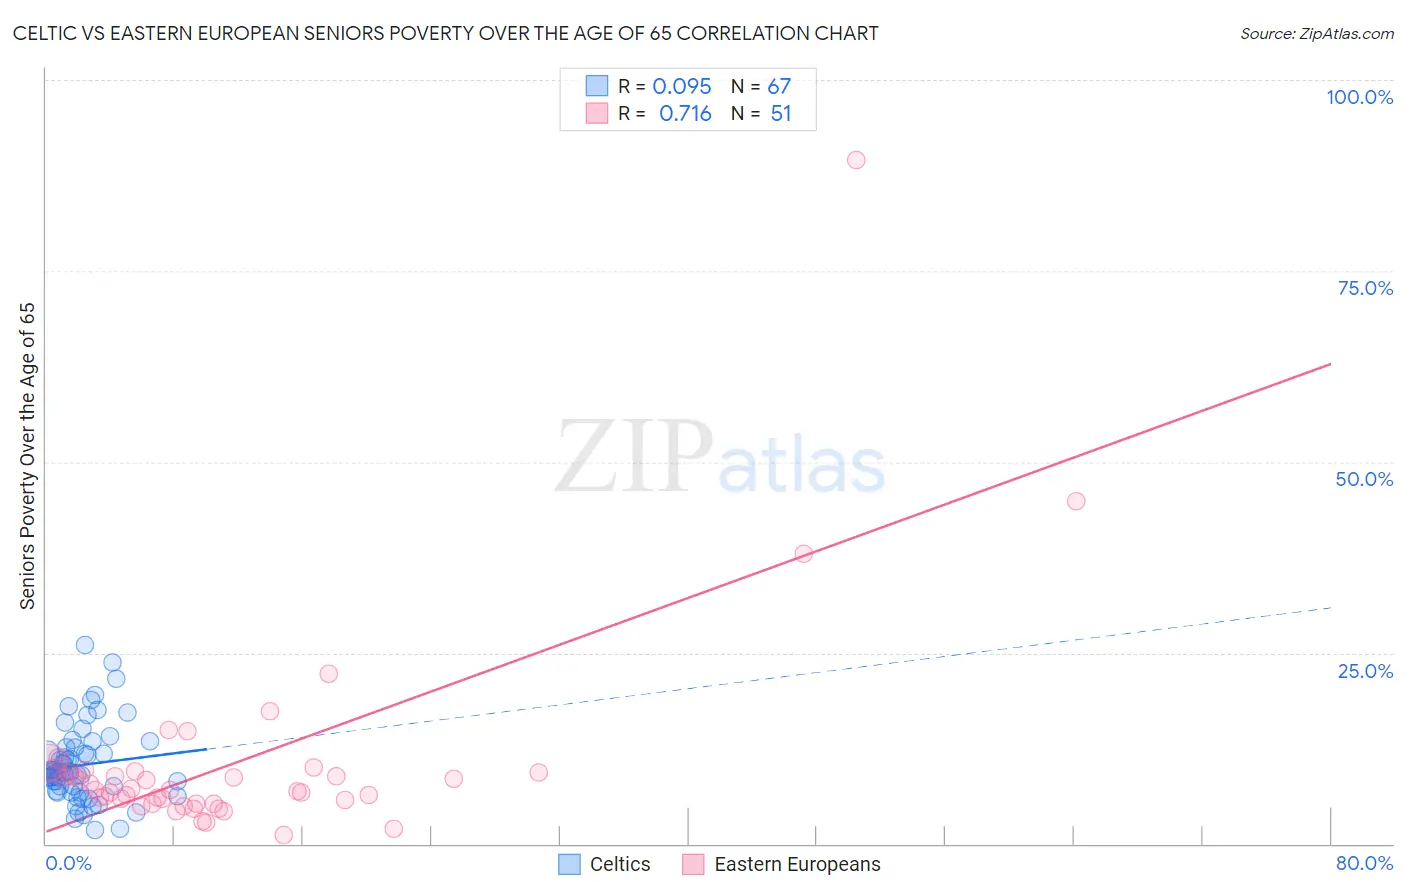
Celtic vs Eastern European Seniors Poverty Over the Age of 65 Correlation Chart
The statistical analysis conducted on geographies consisting of 168,620,059 people shows a slight positive correlation between the proportion of Celtics and poverty level among seniors over the age of 65 in the United States with a correlation coefficient (R) of 0.095 and weighted average of 9.8%. Similarly, the statistical analysis conducted on geographies consisting of 459,049,603 people shows a strong positive correlation between the proportion of Eastern Europeans and poverty level among seniors over the age of 65 in the United States with a correlation coefficient (R) of 0.716 and weighted average of 9.6%, a difference of 2.1%.
Seniors Poverty Over the Age of 65 Correlation Summary
| Measurement | Celtic | Eastern European |
| Minimum | 1.8% | 1.1% |
| Maximum | 26.0% | 89.5% |
| Range | 24.1% | 88.4% |
| Mean | 10.3% | 10.6% |
| Median | 9.4% | 7.0% |
| Interquartile 25% (IQ1) | 6.9% | 5.2% |
| Interquartile 75% (IQ3) | 12.5% | 9.4% |
| Interquartile Range (IQR) | 5.6% | 4.2% |
| Standard Deviation (Sample) | 4.9% | 13.6% |
| Standard Deviation (Population) | 4.9% | 13.5% |
Demographics Similar to Celtics and Eastern Europeans by Seniors Poverty Over the Age of 65
In terms of seniors poverty over the age of 65, the demographic groups most similar to Celtics are Immigrants from Canada (9.8%, a difference of 0.030%), Iranian (9.8%, a difference of 0.080%), Serbian (9.8%, a difference of 0.18%), Bolivian (9.8%, a difference of 0.25%), and Immigrants from England (9.8%, a difference of 0.37%). Similarly, the demographic groups most similar to Eastern Europeans are Zimbabwean (9.6%, a difference of 0.10%), Austrian (9.6%, a difference of 0.10%), Immigrants from North Macedonia (9.6%, a difference of 0.26%), Estonian (9.6%, a difference of 0.28%), and Immigrants from Taiwan (9.7%, a difference of 0.42%).
| Demographics | Rating | Rank | Seniors Poverty Over the Age of 65 |
| Immigrants | North Macedonia | 99.6 /100 | #41 | Exceptional 9.6% |
| Zimbabweans | 99.6 /100 | #42 | Exceptional 9.6% |
| Eastern Europeans | 99.6 /100 | #43 | Exceptional 9.6% |
| Austrians | 99.5 /100 | #44 | Exceptional 9.6% |
| Estonians | 99.5 /100 | #45 | Exceptional 9.6% |
| Immigrants | Taiwan | 99.5 /100 | #46 | Exceptional 9.7% |
| Immigrants | South Central Asia | 99.5 /100 | #47 | Exceptional 9.7% |
| French | 99.5 /100 | #48 | Exceptional 9.7% |
| Immigrants | Lithuania | 99.4 /100 | #49 | Exceptional 9.7% |
| Hungarians | 99.4 /100 | #50 | Exceptional 9.7% |
| Carpatho Rusyns | 99.3 /100 | #51 | Exceptional 9.7% |
| Filipinos | 99.3 /100 | #52 | Exceptional 9.7% |
| Slavs | 99.2 /100 | #53 | Exceptional 9.8% |
| Immigrants | Northern Europe | 99.2 /100 | #54 | Exceptional 9.8% |
| Afghans | 99.2 /100 | #55 | Exceptional 9.8% |
| Immigrants | England | 99.1 /100 | #56 | Exceptional 9.8% |
| Bolivians | 99.1 /100 | #57 | Exceptional 9.8% |
| Serbians | 99.1 /100 | #58 | Exceptional 9.8% |
| Immigrants | Canada | 99.0 /100 | #59 | Exceptional 9.8% |
| Celtics | 99.0 /100 | #60 | Exceptional 9.8% |
| Iranians | 98.9 /100 | #61 | Exceptional 9.8% |