Immigrants from Haiti vs Nonimmigrants Seniors Poverty Over the Age of 65
COMPARE
Immigrants from Haiti
Nonimmigrants
Seniors Poverty Over the Age of 65
Seniors Poverty Over the Age of 65 Comparison
Immigrants from Haiti
Nonimmigrants
14.7%
SENIORS POVERTY OVER THE AGE OF 65
0.0/ 100
METRIC RATING
320th/ 347
METRIC RANK
10.9%
SENIORS POVERTY OVER THE AGE OF 65
55.1/ 100
METRIC RATING
171st/ 347
METRIC RANK
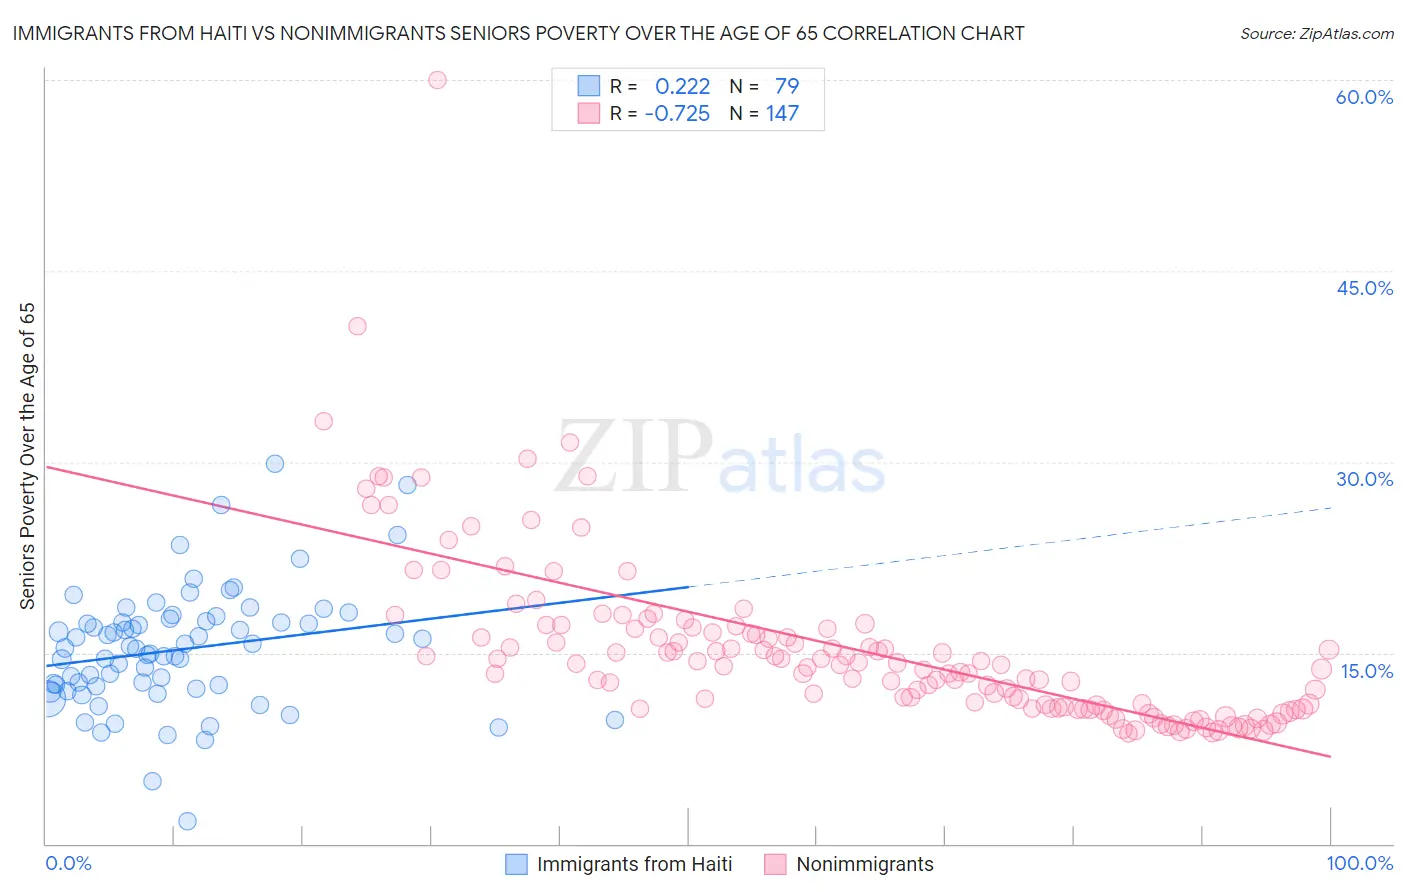
Immigrants from Haiti vs Nonimmigrants Seniors Poverty Over the Age of 65 Correlation Chart
The statistical analysis conducted on geographies consisting of 224,688,220 people shows a weak positive correlation between the proportion of Immigrants from Haiti and poverty level among seniors over the age of 65 in the United States with a correlation coefficient (R) of 0.222 and weighted average of 14.7%. Similarly, the statistical analysis conducted on geographies consisting of 577,791,291 people shows a strong negative correlation between the proportion of Nonimmigrants and poverty level among seniors over the age of 65 in the United States with a correlation coefficient (R) of -0.725 and weighted average of 10.9%, a difference of 34.9%.
Seniors Poverty Over the Age of 65 Correlation Summary
| Measurement | Immigrants from Haiti | Nonimmigrants |
| Minimum | 1.8% | 8.7% |
| Maximum | 29.8% | 60.0% |
| Range | 28.1% | 51.3% |
| Mean | 15.3% | 15.3% |
| Median | 15.4% | 14.0% |
| Interquartile 25% (IQ1) | 12.4% | 10.6% |
| Interquartile 75% (IQ3) | 17.5% | 16.9% |
| Interquartile Range (IQR) | 5.1% | 6.2% |
| Standard Deviation (Sample) | 4.7% | 6.8% |
| Standard Deviation (Population) | 4.7% | 6.8% |
Similar Demographics by Seniors Poverty Over the Age of 65
Demographics Similar to Immigrants from Haiti by Seniors Poverty Over the Age of 65
In terms of seniors poverty over the age of 65, the demographic groups most similar to Immigrants from Haiti are Cape Verdean (14.7%, a difference of 0.18%), Houma (14.7%, a difference of 0.21%), Immigrants from Barbados (14.8%, a difference of 0.59%), Yakama (14.8%, a difference of 0.75%), and Immigrants from Honduras (14.5%, a difference of 1.3%).
| Demographics | Rating | Rank | Seniors Poverty Over the Age of 65 |
| Barbadians | 0.0 /100 | #313 | Tragic 14.4% |
| Guyanese | 0.0 /100 | #314 | Tragic 14.4% |
| Immigrants | Ecuador | 0.0 /100 | #315 | Tragic 14.4% |
| Immigrants | Guyana | 0.0 /100 | #316 | Tragic 14.5% |
| Haitians | 0.0 /100 | #317 | Tragic 14.5% |
| Immigrants | Honduras | 0.0 /100 | #318 | Tragic 14.5% |
| Cape Verdeans | 0.0 /100 | #319 | Tragic 14.7% |
| Immigrants | Haiti | 0.0 /100 | #320 | Tragic 14.7% |
| Houma | 0.0 /100 | #321 | Tragic 14.7% |
| Immigrants | Barbados | 0.0 /100 | #322 | Tragic 14.8% |
| Yakama | 0.0 /100 | #323 | Tragic 14.8% |
| Nicaraguans | 0.0 /100 | #324 | Tragic 15.0% |
| Central American Indians | 0.0 /100 | #325 | Tragic 15.1% |
| Immigrants | Armenia | 0.0 /100 | #326 | Tragic 15.2% |
| Crow | 0.0 /100 | #327 | Tragic 15.2% |
Demographics Similar to Nonimmigrants by Seniors Poverty Over the Age of 65
In terms of seniors poverty over the age of 65, the demographic groups most similar to Nonimmigrants are Immigrants from Syria (10.9%, a difference of 0.040%), Immigrants from Eastern Europe (10.9%, a difference of 0.060%), Sri Lankan (10.9%, a difference of 0.16%), Mongolian (10.9%, a difference of 0.26%), and Spaniard (10.9%, a difference of 0.39%).
| Demographics | Rating | Rank | Seniors Poverty Over the Age of 65 |
| Potawatomi | 62.6 /100 | #164 | Good 10.8% |
| Immigrants | South Eastern Asia | 62.1 /100 | #165 | Good 10.8% |
| Malaysians | 62.0 /100 | #166 | Good 10.8% |
| Alaska Natives | 60.3 /100 | #167 | Good 10.8% |
| Mongolians | 58.0 /100 | #168 | Average 10.9% |
| Sri Lankans | 56.8 /100 | #169 | Average 10.9% |
| Immigrants | Eastern Europe | 55.8 /100 | #170 | Average 10.9% |
| Immigrants | Nonimmigrants | 55.1 /100 | #171 | Average 10.9% |
| Immigrants | Syria | 54.7 /100 | #172 | Average 10.9% |
| Spaniards | 50.7 /100 | #173 | Average 10.9% |
| Immigrants | Sudan | 50.0 /100 | #174 | Average 10.9% |
| Creek | 49.6 /100 | #175 | Average 10.9% |
| Immigrants | Malaysia | 47.9 /100 | #176 | Average 11.0% |
| Cherokee | 47.3 /100 | #177 | Average 11.0% |
| German Russians | 46.9 /100 | #178 | Average 11.0% |