Celtic vs Immigrants Seniors Poverty Over the Age of 65
COMPARE
Celtic
Immigrants
Seniors Poverty Over the Age of 65
Seniors Poverty Over the Age of 65 Comparison
Celtics
Immigrants
9.8%
SENIORS POVERTY OVER THE AGE OF 65
99.0/ 100
METRIC RATING
60th/ 347
METRIC RANK
12.4%
SENIORS POVERTY OVER THE AGE OF 65
0.2/ 100
METRIC RATING
257th/ 347
METRIC RANK
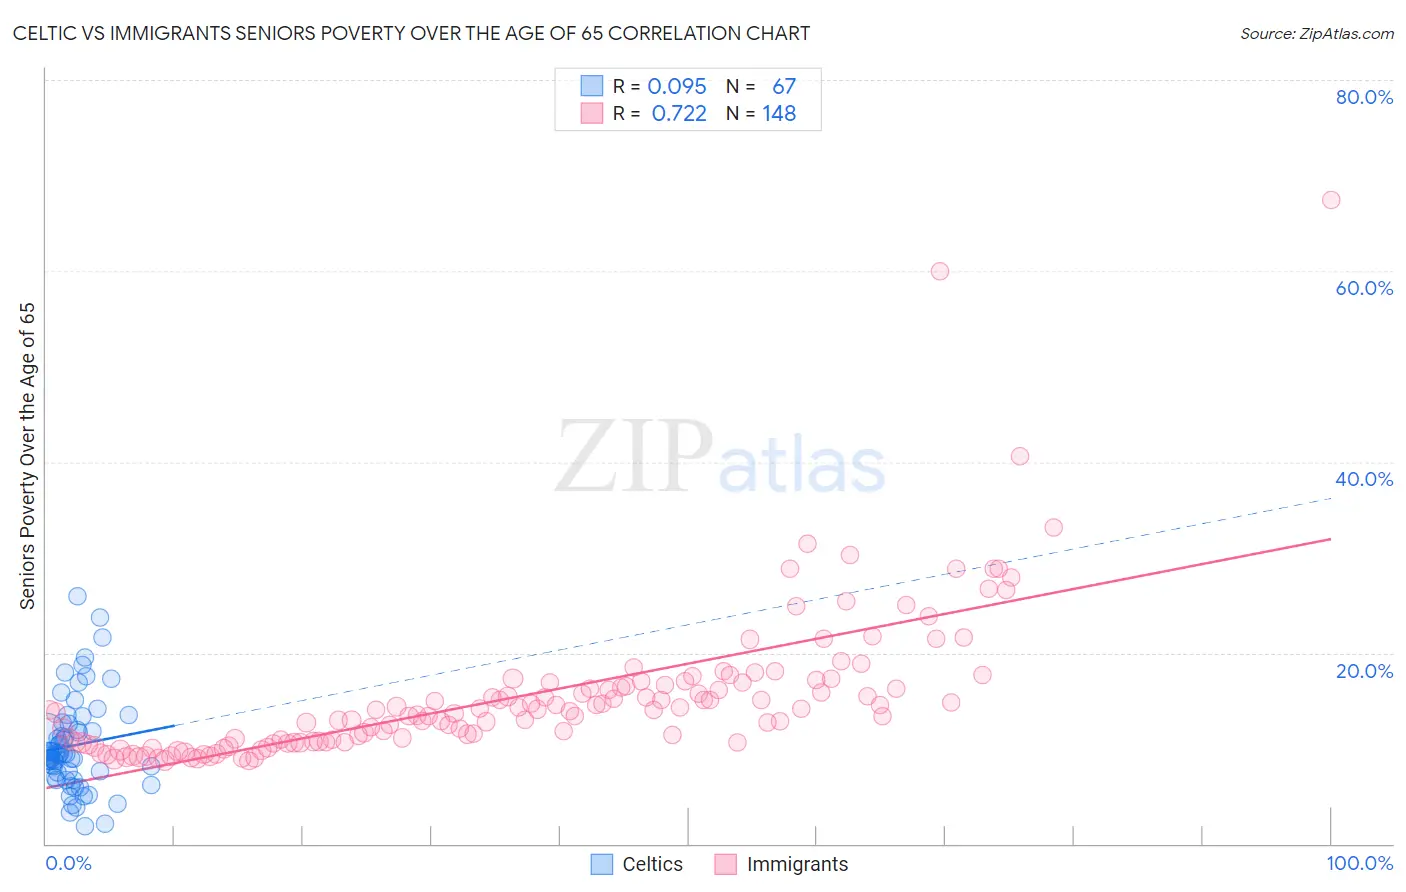
Celtic vs Immigrants Seniors Poverty Over the Age of 65 Correlation Chart
The statistical analysis conducted on geographies consisting of 168,620,059 people shows a slight positive correlation between the proportion of Celtics and poverty level among seniors over the age of 65 in the United States with a correlation coefficient (R) of 0.095 and weighted average of 9.8%. Similarly, the statistical analysis conducted on geographies consisting of 571,862,894 people shows a strong positive correlation between the proportion of Immigrants and poverty level among seniors over the age of 65 in the United States with a correlation coefficient (R) of 0.722 and weighted average of 12.4%, a difference of 26.4%.
Seniors Poverty Over the Age of 65 Correlation Summary
| Measurement | Celtic | Immigrants |
| Minimum | 1.8% | 8.7% |
| Maximum | 26.0% | 67.5% |
| Range | 24.1% | 58.8% |
| Mean | 10.3% | 15.6% |
| Median | 9.4% | 14.0% |
| Interquartile 25% (IQ1) | 6.9% | 10.7% |
| Interquartile 75% (IQ3) | 12.5% | 16.9% |
| Interquartile Range (IQR) | 5.6% | 6.2% |
| Standard Deviation (Sample) | 4.9% | 8.0% |
| Standard Deviation (Population) | 4.9% | 8.0% |
Similar Demographics by Seniors Poverty Over the Age of 65
Demographics Similar to Celtics by Seniors Poverty Over the Age of 65
In terms of seniors poverty over the age of 65, the demographic groups most similar to Celtics are Immigrants from Canada (9.8%, a difference of 0.030%), Iranian (9.8%, a difference of 0.080%), French Canadian (9.8%, a difference of 0.13%), Serbian (9.8%, a difference of 0.18%), and Bolivian (9.8%, a difference of 0.25%).
| Demographics | Rating | Rank | Seniors Poverty Over the Age of 65 |
| Slavs | 99.2 /100 | #53 | Exceptional 9.8% |
| Immigrants | Northern Europe | 99.2 /100 | #54 | Exceptional 9.8% |
| Afghans | 99.2 /100 | #55 | Exceptional 9.8% |
| Immigrants | England | 99.1 /100 | #56 | Exceptional 9.8% |
| Bolivians | 99.1 /100 | #57 | Exceptional 9.8% |
| Serbians | 99.1 /100 | #58 | Exceptional 9.8% |
| Immigrants | Canada | 99.0 /100 | #59 | Exceptional 9.8% |
| Celtics | 99.0 /100 | #60 | Exceptional 9.8% |
| Iranians | 98.9 /100 | #61 | Exceptional 9.8% |
| French Canadians | 98.9 /100 | #62 | Exceptional 9.8% |
| Macedonians | 98.8 /100 | #63 | Exceptional 9.9% |
| Immigrants | North America | 98.8 /100 | #64 | Exceptional 9.9% |
| Pennsylvania Germans | 98.7 /100 | #65 | Exceptional 9.9% |
| Immigrants | Netherlands | 98.7 /100 | #66 | Exceptional 9.9% |
| Immigrants | Austria | 98.6 /100 | #67 | Exceptional 9.9% |
Demographics Similar to Immigrants by Seniors Poverty Over the Age of 65
In terms of seniors poverty over the age of 65, the demographic groups most similar to Immigrants are Immigrants from Panama (12.4%, a difference of 0.010%), Mexican American Indian (12.4%, a difference of 0.24%), Dutch West Indian (12.4%, a difference of 0.25%), Ghanaian (12.4%, a difference of 0.28%), and Immigrants from Cambodia (12.4%, a difference of 0.37%).
| Demographics | Rating | Rank | Seniors Poverty Over the Age of 65 |
| Immigrants | Liberia | 0.5 /100 | #250 | Tragic 12.2% |
| Somalis | 0.3 /100 | #251 | Tragic 12.3% |
| Armenians | 0.3 /100 | #252 | Tragic 12.3% |
| Shoshone | 0.3 /100 | #253 | Tragic 12.3% |
| Immigrants | Cambodia | 0.3 /100 | #254 | Tragic 12.4% |
| Mexican American Indians | 0.3 /100 | #255 | Tragic 12.4% |
| Immigrants | Panama | 0.2 /100 | #256 | Tragic 12.4% |
| Immigrants | Immigrants | 0.2 /100 | #257 | Tragic 12.4% |
| Dutch West Indians | 0.2 /100 | #258 | Tragic 12.4% |
| Ghanaians | 0.2 /100 | #259 | Tragic 12.4% |
| South Americans | 0.2 /100 | #260 | Tragic 12.5% |
| Colombians | 0.2 /100 | #261 | Tragic 12.5% |
| Venezuelans | 0.1 /100 | #262 | Tragic 12.5% |
| Soviet Union | 0.1 /100 | #263 | Tragic 12.6% |
| Inupiat | 0.1 /100 | #264 | Tragic 12.6% |