Carpatho Rusyn vs Fijian Single Father Poverty
COMPARE
Carpatho Rusyn
Fijian
Single Father Poverty
Single Father Poverty Comparison
Carpatho Rusyns
Fijians
18.0%
SINGLE FATHER POVERTY
0.0/ 100
METRIC RATING
287th/ 347
METRIC RANK
15.7%
SINGLE FATHER POVERTY
96.8/ 100
METRIC RATING
101st/ 347
METRIC RANK
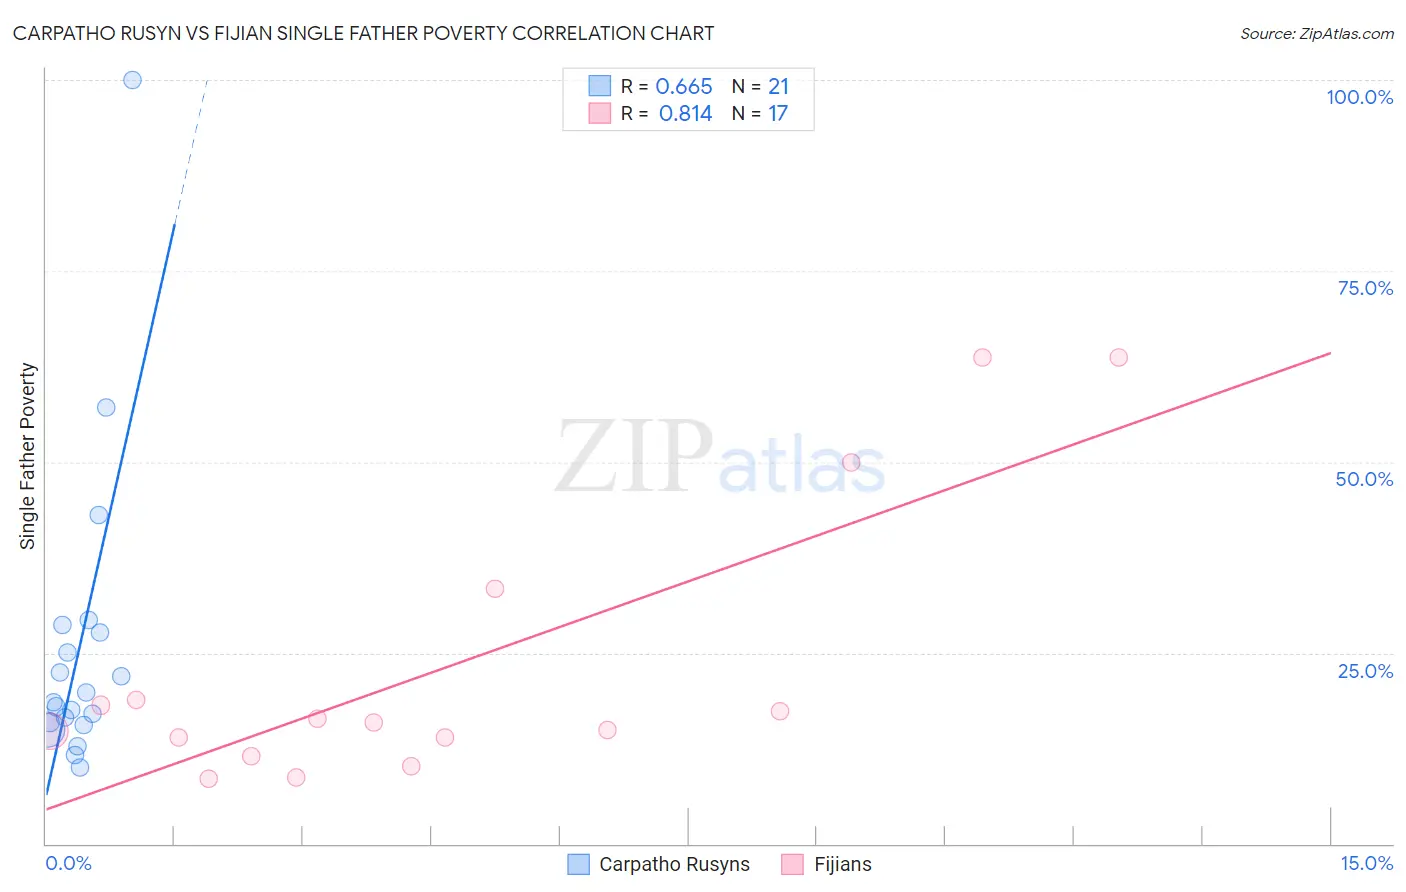
Carpatho Rusyn vs Fijian Single Father Poverty Correlation Chart
The statistical analysis conducted on geographies consisting of 53,631,013 people shows a significant positive correlation between the proportion of Carpatho Rusyns and poverty level among single fathers in the United States with a correlation coefficient (R) of 0.665 and weighted average of 18.0%. Similarly, the statistical analysis conducted on geographies consisting of 52,243,042 people shows a very strong positive correlation between the proportion of Fijians and poverty level among single fathers in the United States with a correlation coefficient (R) of 0.814 and weighted average of 15.7%, a difference of 14.5%.
Single Father Poverty Correlation Summary
| Measurement | Carpatho Rusyn | Fijian |
| Minimum | 10.0% | 8.5% |
| Maximum | 100.0% | 63.6% |
| Range | 90.0% | 55.2% |
| Mean | 25.9% | 23.1% |
| Median | 18.6% | 15.9% |
| Interquartile 25% (IQ1) | 15.7% | 12.7% |
| Interquartile 75% (IQ3) | 28.1% | 26.1% |
| Interquartile Range (IQR) | 12.4% | 13.4% |
| Standard Deviation (Sample) | 20.2% | 18.2% |
| Standard Deviation (Population) | 19.7% | 17.7% |
Similar Demographics by Single Father Poverty
Demographics Similar to Carpatho Rusyns by Single Father Poverty
In terms of single father poverty, the demographic groups most similar to Carpatho Rusyns are Bahamian (18.0%, a difference of 0.020%), Immigrants from North Macedonia (17.9%, a difference of 0.22%), Immigrants from Lebanon (17.9%, a difference of 0.40%), Irish (18.0%, a difference of 0.46%), and West Indian (18.0%, a difference of 0.49%).
| Demographics | Rating | Rank | Single Father Poverty |
| Scottish | 0.0 /100 | #280 | Tragic 17.7% |
| English | 0.0 /100 | #281 | Tragic 17.8% |
| Dutch | 0.0 /100 | #282 | Tragic 17.8% |
| Alsatians | 0.0 /100 | #283 | Tragic 17.8% |
| Welsh | 0.0 /100 | #284 | Tragic 17.8% |
| Immigrants | Lebanon | 0.0 /100 | #285 | Tragic 17.9% |
| Immigrants | North Macedonia | 0.0 /100 | #286 | Tragic 17.9% |
| Carpatho Rusyns | 0.0 /100 | #287 | Tragic 18.0% |
| Bahamians | 0.0 /100 | #288 | Tragic 18.0% |
| Irish | 0.0 /100 | #289 | Tragic 18.0% |
| West Indians | 0.0 /100 | #290 | Tragic 18.0% |
| Alaskan Athabascans | 0.0 /100 | #291 | Tragic 18.1% |
| Immigrants | Bahamas | 0.0 /100 | #292 | Tragic 18.1% |
| Alaska Natives | 0.0 /100 | #293 | Tragic 18.1% |
| U.S. Virgin Islanders | 0.0 /100 | #294 | Tragic 18.1% |
Demographics Similar to Fijians by Single Father Poverty
In terms of single father poverty, the demographic groups most similar to Fijians are Immigrants from Chile (15.7%, a difference of 0.030%), Chilean (15.7%, a difference of 0.16%), South American Indian (15.7%, a difference of 0.22%), Australian (15.7%, a difference of 0.24%), and Immigrants from Middle Africa (15.6%, a difference of 0.25%).
| Demographics | Rating | Rank | Single Father Poverty |
| Immigrants | Uruguay | 98.2 /100 | #94 | Exceptional 15.6% |
| Immigrants | Kazakhstan | 98.2 /100 | #95 | Exceptional 15.6% |
| Immigrants | Belgium | 98.1 /100 | #96 | Exceptional 15.6% |
| Yaqui | 98.1 /100 | #97 | Exceptional 15.6% |
| Zimbabweans | 98.1 /100 | #98 | Exceptional 15.6% |
| Immigrants | Middle Africa | 97.4 /100 | #99 | Exceptional 15.6% |
| Immigrants | Chile | 96.9 /100 | #100 | Exceptional 15.7% |
| Fijians | 96.8 /100 | #101 | Exceptional 15.7% |
| Chileans | 96.4 /100 | #102 | Exceptional 15.7% |
| South American Indians | 96.2 /100 | #103 | Exceptional 15.7% |
| Australians | 96.1 /100 | #104 | Exceptional 15.7% |
| Immigrants | Australia | 96.1 /100 | #105 | Exceptional 15.7% |
| Immigrants | Poland | 95.8 /100 | #106 | Exceptional 15.7% |
| Native Hawaiians | 95.8 /100 | #107 | Exceptional 15.7% |
| Pakistanis | 95.7 /100 | #108 | Exceptional 15.7% |