Cape Verdean vs Fijian Female Poverty Among 18-24 Year Olds
COMPARE
Cape Verdean
Fijian
Female Poverty Among 18-24 Year Olds
Female Poverty Among 18-24 Year Olds Comparison
Cape Verdeans
Fijians
19.4%
FEMALE POVERTY AMONG 18-24 YEAR OLDS
93.6/ 100
METRIC RATING
127th/ 347
METRIC RANK
20.0%
FEMALE POVERTY AMONG 18-24 YEAR OLDS
59.1/ 100
METRIC RATING
168th/ 347
METRIC RANK
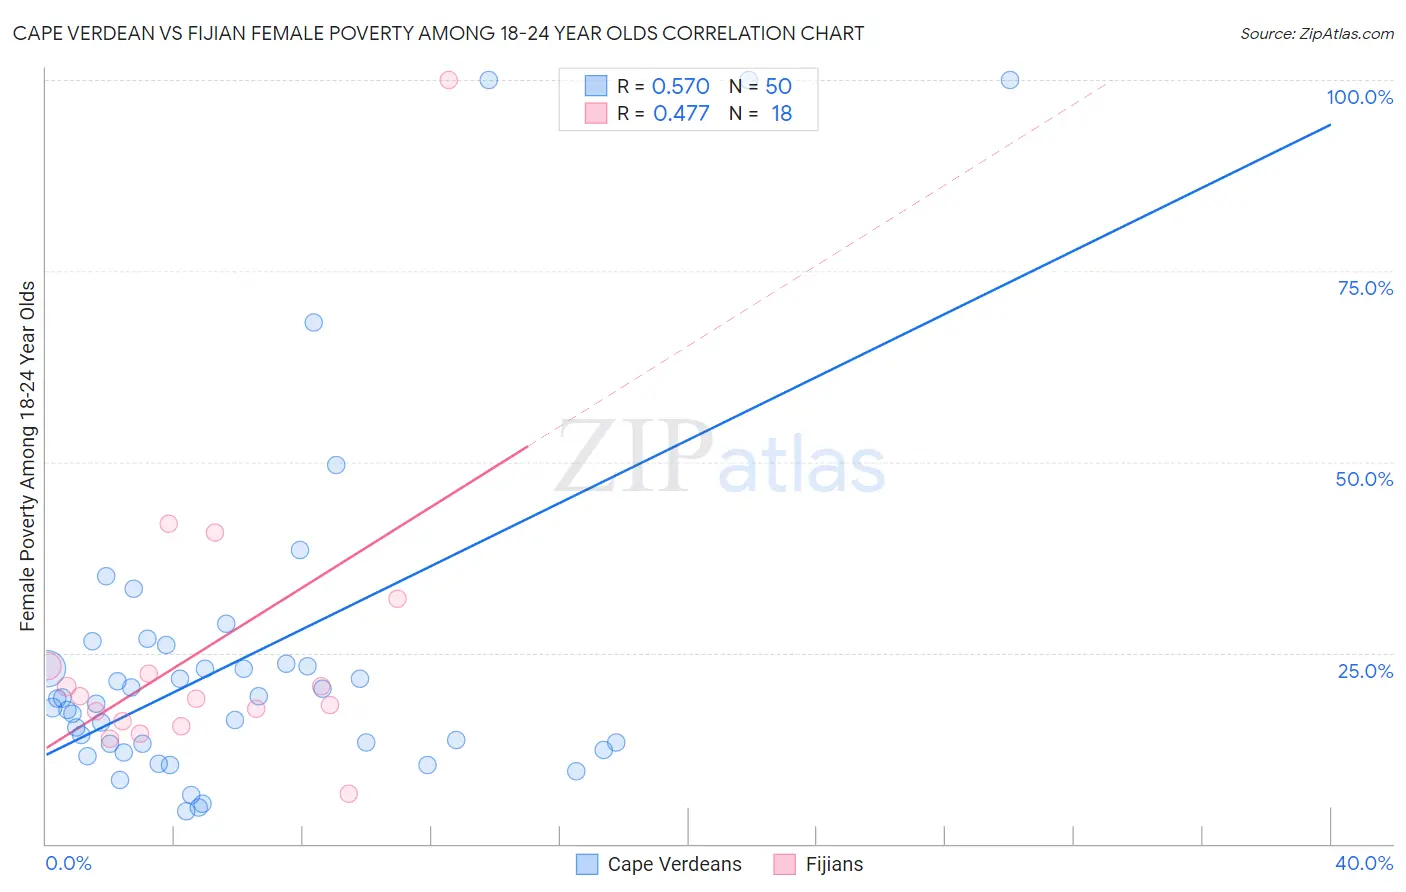
Cape Verdean vs Fijian Female Poverty Among 18-24 Year Olds Correlation Chart
The statistical analysis conducted on geographies consisting of 106,282,002 people shows a substantial positive correlation between the proportion of Cape Verdeans and poverty level among females between the ages 18 and 24 in the United States with a correlation coefficient (R) of 0.570 and weighted average of 19.4%. Similarly, the statistical analysis conducted on geographies consisting of 55,734,128 people shows a moderate positive correlation between the proportion of Fijians and poverty level among females between the ages 18 and 24 in the United States with a correlation coefficient (R) of 0.477 and weighted average of 20.0%, a difference of 2.9%.
Female Poverty Among 18-24 Year Olds Correlation Summary
| Measurement | Cape Verdean | Fijian |
| Minimum | 4.2% | 6.5% |
| Maximum | 100.0% | 100.0% |
| Range | 95.8% | 93.5% |
| Mean | 24.3% | 25.5% |
| Median | 18.6% | 19.1% |
| Interquartile 25% (IQ1) | 13.1% | 16.1% |
| Interquartile 75% (IQ3) | 23.6% | 23.3% |
| Interquartile Range (IQR) | 10.5% | 7.2% |
| Standard Deviation (Sample) | 22.3% | 20.6% |
| Standard Deviation (Population) | 22.1% | 20.1% |
Similar Demographics by Female Poverty Among 18-24 Year Olds
Demographics Similar to Cape Verdeans by Female Poverty Among 18-24 Year Olds
In terms of female poverty among 18-24 year olds, the demographic groups most similar to Cape Verdeans are Immigrants from Russia (19.4%, a difference of 0.020%), Immigrants from Panama (19.4%, a difference of 0.080%), Slovak (19.5%, a difference of 0.13%), Immigrants from England (19.5%, a difference of 0.14%), and Immigrants from Canada (19.5%, a difference of 0.14%).
| Demographics | Rating | Rank | Female Poverty Among 18-24 Year Olds |
| Immigrants | Northern Europe | 95.4 /100 | #120 | Exceptional 19.4% |
| Guyanese | 95.3 /100 | #121 | Exceptional 19.4% |
| Cambodians | 94.6 /100 | #122 | Exceptional 19.4% |
| Paraguayans | 94.6 /100 | #123 | Exceptional 19.4% |
| Immigrants | Chile | 94.3 /100 | #124 | Exceptional 19.4% |
| Immigrants | Panama | 94.0 /100 | #125 | Exceptional 19.4% |
| Immigrants | Russia | 93.7 /100 | #126 | Exceptional 19.4% |
| Cape Verdeans | 93.6 /100 | #127 | Exceptional 19.4% |
| Slovaks | 92.9 /100 | #128 | Exceptional 19.5% |
| Immigrants | England | 92.9 /100 | #129 | Exceptional 19.5% |
| Immigrants | Canada | 92.9 /100 | #130 | Exceptional 19.5% |
| Latvians | 92.7 /100 | #131 | Exceptional 19.5% |
| Jamaicans | 92.1 /100 | #132 | Exceptional 19.5% |
| Turks | 92.1 /100 | #133 | Exceptional 19.5% |
| Immigrants | North America | 92.1 /100 | #134 | Exceptional 19.5% |
Demographics Similar to Fijians by Female Poverty Among 18-24 Year Olds
In terms of female poverty among 18-24 year olds, the demographic groups most similar to Fijians are Czechoslovakian (20.0%, a difference of 0.14%), Hmong (20.0%, a difference of 0.19%), Iranian (20.1%, a difference of 0.22%), Immigrants from Nigeria (20.1%, a difference of 0.24%), and Belizean (20.1%, a difference of 0.35%).
| Demographics | Rating | Rank | Female Poverty Among 18-24 Year Olds |
| Immigrants | Belize | 74.1 /100 | #161 | Good 19.8% |
| French Canadians | 73.0 /100 | #162 | Good 19.9% |
| Malaysians | 72.7 /100 | #163 | Good 19.9% |
| Central Americans | 70.0 /100 | #164 | Good 19.9% |
| Eastern Europeans | 69.3 /100 | #165 | Good 19.9% |
| Belgians | 69.1 /100 | #166 | Good 19.9% |
| Czechoslovakians | 61.8 /100 | #167 | Good 20.0% |
| Fijians | 59.1 /100 | #168 | Average 20.0% |
| Hmong | 55.4 /100 | #169 | Average 20.0% |
| Iranians | 54.7 /100 | #170 | Average 20.1% |
| Immigrants | Nigeria | 54.3 /100 | #171 | Average 20.1% |
| Belizeans | 52.0 /100 | #172 | Average 20.1% |
| Irish | 50.0 /100 | #173 | Average 20.1% |
| Swedes | 50.0 /100 | #174 | Average 20.1% |
| South American Indians | 48.4 /100 | #175 | Average 20.1% |