Cape Verdean vs Ghanaian Female Poverty Among 18-24 Year Olds
COMPARE
Cape Verdean
Ghanaian
Female Poverty Among 18-24 Year Olds
Female Poverty Among 18-24 Year Olds Comparison
Cape Verdeans
Ghanaians
19.4%
FEMALE POVERTY AMONG 18-24 YEAR OLDS
93.6/ 100
METRIC RATING
127th/ 347
METRIC RANK
20.8%
FEMALE POVERTY AMONG 18-24 YEAR OLDS
6.5/ 100
METRIC RATING
228th/ 347
METRIC RANK
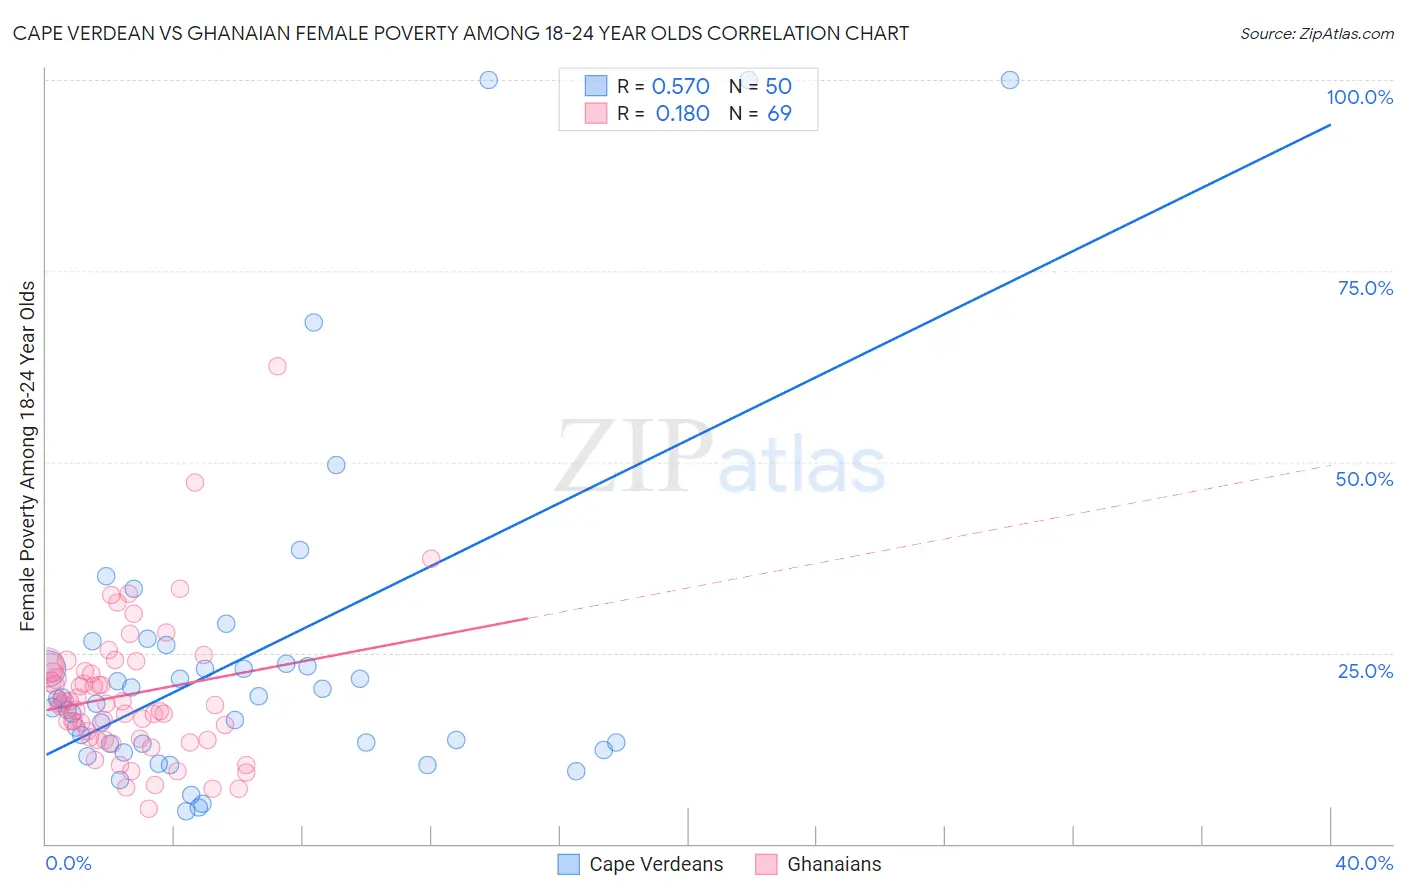
Cape Verdean vs Ghanaian Female Poverty Among 18-24 Year Olds Correlation Chart
The statistical analysis conducted on geographies consisting of 106,282,002 people shows a substantial positive correlation between the proportion of Cape Verdeans and poverty level among females between the ages 18 and 24 in the United States with a correlation coefficient (R) of 0.570 and weighted average of 19.4%. Similarly, the statistical analysis conducted on geographies consisting of 188,784,310 people shows a poor positive correlation between the proportion of Ghanaians and poverty level among females between the ages 18 and 24 in the United States with a correlation coefficient (R) of 0.180 and weighted average of 20.8%, a difference of 6.8%.
Female Poverty Among 18-24 Year Olds Correlation Summary
| Measurement | Cape Verdean | Ghanaian |
| Minimum | 4.2% | 4.6% |
| Maximum | 100.0% | 62.5% |
| Range | 95.8% | 57.9% |
| Mean | 24.3% | 19.5% |
| Median | 18.6% | 18.3% |
| Interquartile 25% (IQ1) | 13.1% | 13.6% |
| Interquartile 75% (IQ3) | 23.6% | 22.9% |
| Interquartile Range (IQR) | 10.5% | 9.3% |
| Standard Deviation (Sample) | 22.3% | 9.3% |
| Standard Deviation (Population) | 22.1% | 9.2% |
Similar Demographics by Female Poverty Among 18-24 Year Olds
Demographics Similar to Cape Verdeans by Female Poverty Among 18-24 Year Olds
In terms of female poverty among 18-24 year olds, the demographic groups most similar to Cape Verdeans are Immigrants from Russia (19.4%, a difference of 0.020%), Immigrants from Panama (19.4%, a difference of 0.080%), Slovak (19.5%, a difference of 0.13%), Immigrants from England (19.5%, a difference of 0.14%), and Immigrants from Canada (19.5%, a difference of 0.14%).
| Demographics | Rating | Rank | Female Poverty Among 18-24 Year Olds |
| Immigrants | Northern Europe | 95.4 /100 | #120 | Exceptional 19.4% |
| Guyanese | 95.3 /100 | #121 | Exceptional 19.4% |
| Cambodians | 94.6 /100 | #122 | Exceptional 19.4% |
| Paraguayans | 94.6 /100 | #123 | Exceptional 19.4% |
| Immigrants | Chile | 94.3 /100 | #124 | Exceptional 19.4% |
| Immigrants | Panama | 94.0 /100 | #125 | Exceptional 19.4% |
| Immigrants | Russia | 93.7 /100 | #126 | Exceptional 19.4% |
| Cape Verdeans | 93.6 /100 | #127 | Exceptional 19.4% |
| Slovaks | 92.9 /100 | #128 | Exceptional 19.5% |
| Immigrants | England | 92.9 /100 | #129 | Exceptional 19.5% |
| Immigrants | Canada | 92.9 /100 | #130 | Exceptional 19.5% |
| Latvians | 92.7 /100 | #131 | Exceptional 19.5% |
| Jamaicans | 92.1 /100 | #132 | Exceptional 19.5% |
| Turks | 92.1 /100 | #133 | Exceptional 19.5% |
| Immigrants | North America | 92.1 /100 | #134 | Exceptional 19.5% |
Demographics Similar to Ghanaians by Female Poverty Among 18-24 Year Olds
In terms of female poverty among 18-24 year olds, the demographic groups most similar to Ghanaians are Immigrants from Sweden (20.7%, a difference of 0.060%), Australian (20.8%, a difference of 0.070%), White/Caucasian (20.8%, a difference of 0.070%), Immigrants from St. Vincent and the Grenadines (20.8%, a difference of 0.090%), and Finnish (20.8%, a difference of 0.10%).
| Demographics | Rating | Rank | Female Poverty Among 18-24 Year Olds |
| Barbadians | 9.0 /100 | #221 | Tragic 20.7% |
| Guatemalans | 8.1 /100 | #222 | Tragic 20.7% |
| French | 7.9 /100 | #223 | Tragic 20.7% |
| Immigrants | Liberia | 7.6 /100 | #224 | Tragic 20.7% |
| Norwegians | 7.3 /100 | #225 | Tragic 20.7% |
| Estonians | 7.2 /100 | #226 | Tragic 20.7% |
| Immigrants | Sweden | 6.8 /100 | #227 | Tragic 20.7% |
| Ghanaians | 6.5 /100 | #228 | Tragic 20.8% |
| Australians | 6.1 /100 | #229 | Tragic 20.8% |
| Whites/Caucasians | 6.1 /100 | #230 | Tragic 20.8% |
| Immigrants | St. Vincent and the Grenadines | 6.0 /100 | #231 | Tragic 20.8% |
| Finns | 6.0 /100 | #232 | Tragic 20.8% |
| Immigrants | Denmark | 5.8 /100 | #233 | Tragic 20.8% |
| Welsh | 5.4 /100 | #234 | Tragic 20.8% |
| Immigrants | Uganda | 5.1 /100 | #235 | Tragic 20.8% |