French American Indian vs Fijian Female Poverty Among 18-24 Year Olds
COMPARE
French American Indian
Fijian
Female Poverty Among 18-24 Year Olds
Female Poverty Among 18-24 Year Olds Comparison
French American Indians
Fijians
22.3%
FEMALE POVERTY AMONG 18-24 YEAR OLDS
0.0/ 100
METRIC RATING
289th/ 347
METRIC RANK
20.0%
FEMALE POVERTY AMONG 18-24 YEAR OLDS
59.1/ 100
METRIC RATING
168th/ 347
METRIC RANK
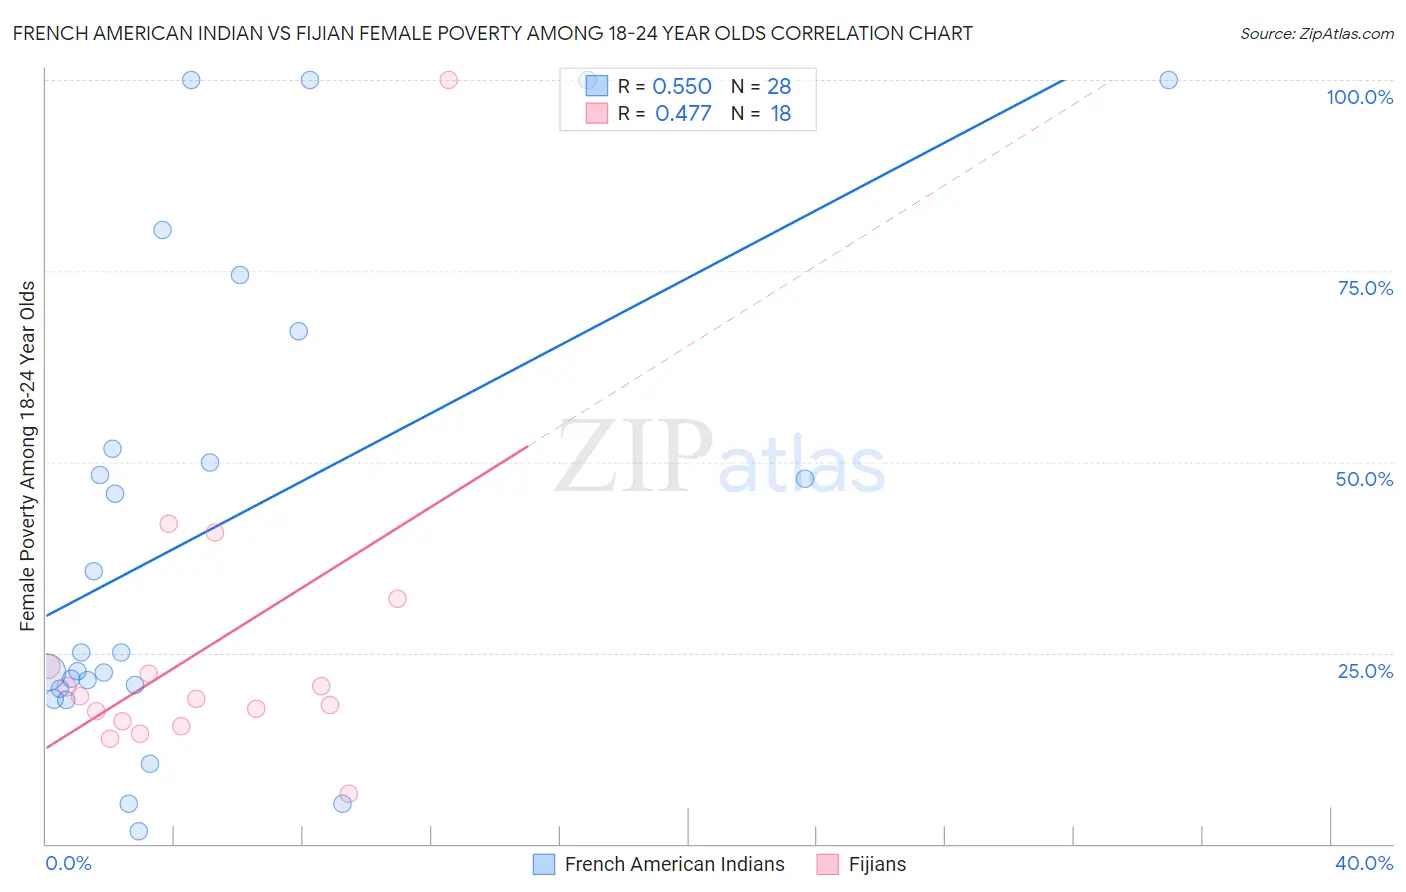
French American Indian vs Fijian Female Poverty Among 18-24 Year Olds Correlation Chart
The statistical analysis conducted on geographies consisting of 130,637,035 people shows a substantial positive correlation between the proportion of French American Indians and poverty level among females between the ages 18 and 24 in the United States with a correlation coefficient (R) of 0.550 and weighted average of 22.3%. Similarly, the statistical analysis conducted on geographies consisting of 55,734,128 people shows a moderate positive correlation between the proportion of Fijians and poverty level among females between the ages 18 and 24 in the United States with a correlation coefficient (R) of 0.477 and weighted average of 20.0%, a difference of 11.3%.
Female Poverty Among 18-24 Year Olds Correlation Summary
| Measurement | French American Indian | Fijian |
| Minimum | 1.6% | 6.5% |
| Maximum | 100.0% | 100.0% |
| Range | 98.4% | 93.5% |
| Mean | 41.6% | 25.5% |
| Median | 25.1% | 19.1% |
| Interquartile 25% (IQ1) | 20.6% | 16.1% |
| Interquartile 75% (IQ3) | 59.4% | 23.3% |
| Interquartile Range (IQR) | 38.8% | 7.2% |
| Standard Deviation (Sample) | 31.5% | 20.6% |
| Standard Deviation (Population) | 30.9% | 20.1% |
Similar Demographics by Female Poverty Among 18-24 Year Olds
Demographics Similar to French American Indians by Female Poverty Among 18-24 Year Olds
In terms of female poverty among 18-24 year olds, the demographic groups most similar to French American Indians are Dominican (22.3%, a difference of 0.070%), Immigrants from Senegal (22.4%, a difference of 0.58%), Immigrants from Middle Africa (22.1%, a difference of 0.83%), Ugandan (22.1%, a difference of 0.84%), and Bangladeshi (22.5%, a difference of 0.86%).
| Demographics | Rating | Rank | Female Poverty Among 18-24 Year Olds |
| Bermudans | 0.1 /100 | #282 | Tragic 21.9% |
| Sub-Saharan Africans | 0.0 /100 | #283 | Tragic 22.0% |
| Tlingit-Haida | 0.0 /100 | #284 | Tragic 22.0% |
| Ottawa | 0.0 /100 | #285 | Tragic 22.0% |
| Ugandans | 0.0 /100 | #286 | Tragic 22.1% |
| Immigrants | Middle Africa | 0.0 /100 | #287 | Tragic 22.1% |
| Dominicans | 0.0 /100 | #288 | Tragic 22.3% |
| French American Indians | 0.0 /100 | #289 | Tragic 22.3% |
| Immigrants | Senegal | 0.0 /100 | #290 | Tragic 22.4% |
| Bangladeshis | 0.0 /100 | #291 | Tragic 22.5% |
| Alaskan Athabascans | 0.0 /100 | #292 | Tragic 22.5% |
| U.S. Virgin Islanders | 0.0 /100 | #293 | Tragic 22.5% |
| Indonesians | 0.0 /100 | #294 | Tragic 22.5% |
| Shoshone | 0.0 /100 | #295 | Tragic 22.5% |
| Menominee | 0.0 /100 | #296 | Tragic 22.5% |
Demographics Similar to Fijians by Female Poverty Among 18-24 Year Olds
In terms of female poverty among 18-24 year olds, the demographic groups most similar to Fijians are Czechoslovakian (20.0%, a difference of 0.14%), Hmong (20.0%, a difference of 0.19%), Iranian (20.1%, a difference of 0.22%), Immigrants from Nigeria (20.1%, a difference of 0.24%), and Belizean (20.1%, a difference of 0.35%).
| Demographics | Rating | Rank | Female Poverty Among 18-24 Year Olds |
| Immigrants | Belize | 74.1 /100 | #161 | Good 19.8% |
| French Canadians | 73.0 /100 | #162 | Good 19.9% |
| Malaysians | 72.7 /100 | #163 | Good 19.9% |
| Central Americans | 70.0 /100 | #164 | Good 19.9% |
| Eastern Europeans | 69.3 /100 | #165 | Good 19.9% |
| Belgians | 69.1 /100 | #166 | Good 19.9% |
| Czechoslovakians | 61.8 /100 | #167 | Good 20.0% |
| Fijians | 59.1 /100 | #168 | Average 20.0% |
| Hmong | 55.4 /100 | #169 | Average 20.0% |
| Iranians | 54.7 /100 | #170 | Average 20.1% |
| Immigrants | Nigeria | 54.3 /100 | #171 | Average 20.1% |
| Belizeans | 52.0 /100 | #172 | Average 20.1% |
| Irish | 50.0 /100 | #173 | Average 20.1% |
| Swedes | 50.0 /100 | #174 | Average 20.1% |
| South American Indians | 48.4 /100 | #175 | Average 20.1% |