Cape Verdean vs Fijian High School Diploma
COMPARE
Cape Verdean
Fijian
High School Diploma
High School Diploma Comparison
Cape Verdeans
Fijians
85.1%
HIGH SCHOOL DIPLOMA
0.0/ 100
METRIC RATING
312th/ 347
METRIC RANK
86.0%
HIGH SCHOOL DIPLOMA
0.0/ 100
METRIC RATING
290th/ 347
METRIC RANK
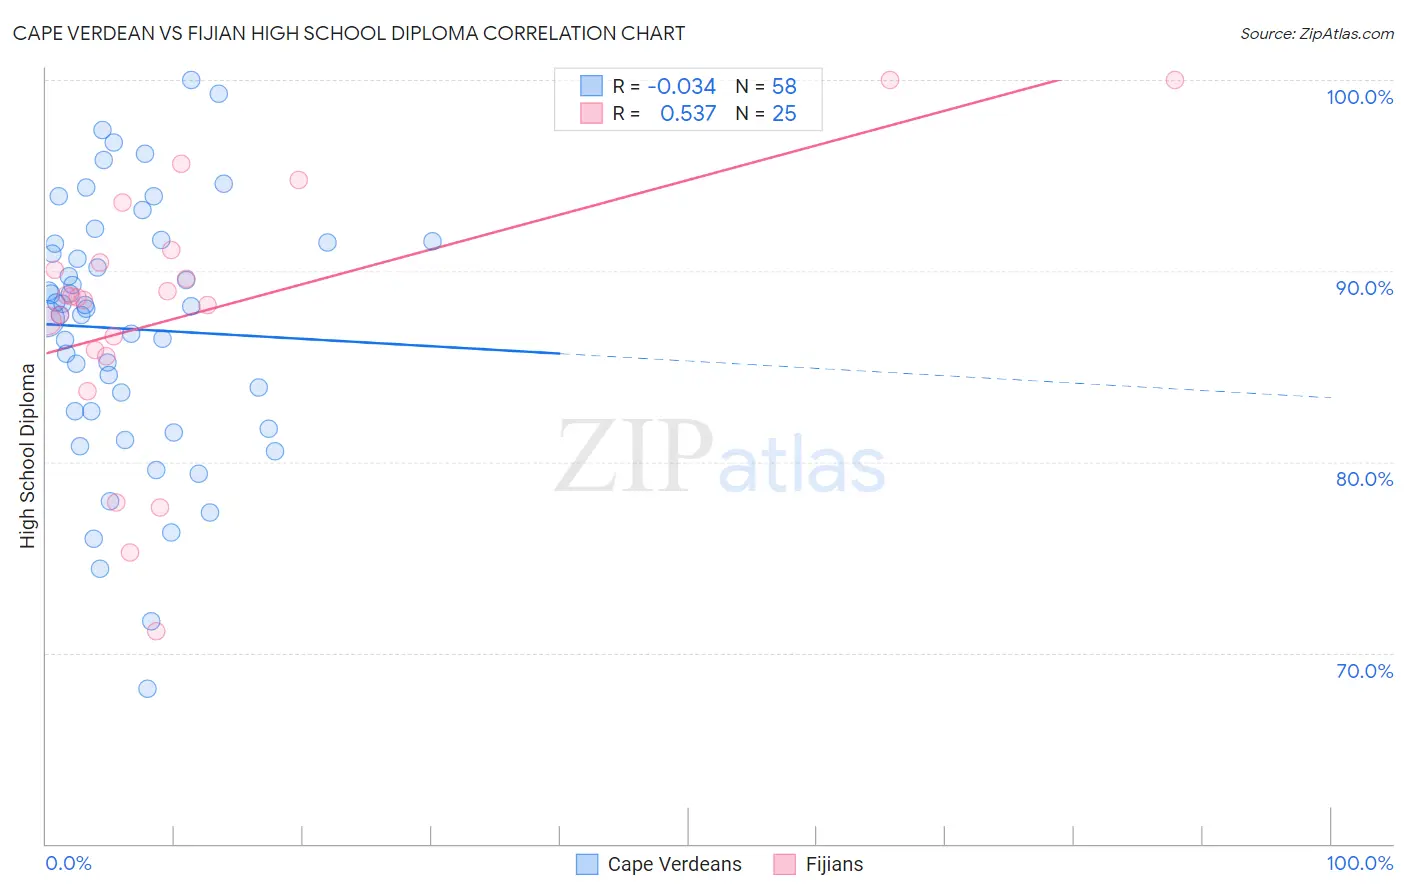
Cape Verdean vs Fijian High School Diploma Correlation Chart
The statistical analysis conducted on geographies consisting of 107,537,955 people shows no correlation between the proportion of Cape Verdeans and percentage of population with at least high school diploma education in the United States with a correlation coefficient (R) of -0.034 and weighted average of 85.1%. Similarly, the statistical analysis conducted on geographies consisting of 55,948,842 people shows a substantial positive correlation between the proportion of Fijians and percentage of population with at least high school diploma education in the United States with a correlation coefficient (R) of 0.537 and weighted average of 86.0%, a difference of 1.1%.
High School Diploma Correlation Summary
| Measurement | Cape Verdean | Fijian |
| Minimum | 68.1% | 71.1% |
| Maximum | 100.0% | 100.0% |
| Range | 31.9% | 28.9% |
| Mean | 87.0% | 87.8% |
| Median | 88.1% | 88.6% |
| Interquartile 25% (IQ1) | 82.7% | 85.7% |
| Interquartile 75% (IQ3) | 91.5% | 90.8% |
| Interquartile Range (IQR) | 8.9% | 5.1% |
| Standard Deviation (Sample) | 6.8% | 6.9% |
| Standard Deviation (Population) | 6.7% | 6.7% |
Similar Demographics by High School Diploma
Demographics Similar to Cape Verdeans by High School Diploma
In terms of high school diploma, the demographic groups most similar to Cape Verdeans are Ecuadorian (85.1%, a difference of 0.050%), Apache (85.1%, a difference of 0.060%), Immigrants from Dominica (85.2%, a difference of 0.14%), Immigrants from Armenia (85.2%, a difference of 0.15%), and Navajo (85.2%, a difference of 0.16%).
| Demographics | Rating | Rank | High School Diploma |
| Immigrants | Portugal | 0.0 /100 | #305 | Tragic 85.3% |
| Immigrants | Guyana | 0.0 /100 | #306 | Tragic 85.3% |
| Navajo | 0.0 /100 | #307 | Tragic 85.2% |
| Immigrants | Armenia | 0.0 /100 | #308 | Tragic 85.2% |
| Immigrants | Dominica | 0.0 /100 | #309 | Tragic 85.2% |
| Apache | 0.0 /100 | #310 | Tragic 85.1% |
| Ecuadorians | 0.0 /100 | #311 | Tragic 85.1% |
| Cape Verdeans | 0.0 /100 | #312 | Tragic 85.1% |
| Immigrants | Ecuador | 0.0 /100 | #313 | Tragic 84.8% |
| Yaqui | 0.0 /100 | #314 | Tragic 84.7% |
| Puerto Ricans | 0.0 /100 | #315 | Tragic 84.7% |
| Belizeans | 0.0 /100 | #316 | Tragic 84.3% |
| Immigrants | Caribbean | 0.0 /100 | #317 | Tragic 84.3% |
| Immigrants | Belize | 0.0 /100 | #318 | Tragic 84.2% |
| Central American Indians | 0.0 /100 | #319 | Tragic 84.2% |
Demographics Similar to Fijians by High School Diploma
In terms of high school diploma, the demographic groups most similar to Fijians are Yup'ik (86.1%, a difference of 0.070%), Haitian (85.9%, a difference of 0.13%), Japanese (85.9%, a difference of 0.14%), British West Indian (85.9%, a difference of 0.16%), and Ute (86.2%, a difference of 0.18%).
| Demographics | Rating | Rank | High School Diploma |
| Immigrants | Barbados | 0.0 /100 | #283 | Tragic 86.4% |
| Paiute | 0.0 /100 | #284 | Tragic 86.4% |
| Immigrants | West Indies | 0.0 /100 | #285 | Tragic 86.2% |
| Immigrants | St. Vincent and the Grenadines | 0.0 /100 | #286 | Tragic 86.2% |
| Ute | 0.0 /100 | #287 | Tragic 86.2% |
| Immigrants | Vietnam | 0.0 /100 | #288 | Tragic 86.2% |
| Yup'ik | 0.0 /100 | #289 | Tragic 86.1% |
| Fijians | 0.0 /100 | #290 | Tragic 86.0% |
| Haitians | 0.0 /100 | #291 | Tragic 85.9% |
| Japanese | 0.0 /100 | #292 | Tragic 85.9% |
| British West Indians | 0.0 /100 | #293 | Tragic 85.9% |
| Immigrants | Fiji | 0.0 /100 | #294 | Tragic 85.8% |
| Immigrants | Immigrants | 0.0 /100 | #295 | Tragic 85.8% |
| Immigrants | Cambodia | 0.0 /100 | #296 | Tragic 85.6% |
| Immigrants | Grenada | 0.0 /100 | #297 | Tragic 85.6% |