Native/Alaskan vs Fijian Female Poverty Among 18-24 Year Olds
COMPARE
Native/Alaskan
Fijian
Female Poverty Among 18-24 Year Olds
Female Poverty Among 18-24 Year Olds Comparison
Natives/Alaskans
Fijians
25.4%
FEMALE POVERTY AMONG 18-24 YEAR OLDS
0.0/ 100
METRIC RATING
328th/ 347
METRIC RANK
20.0%
FEMALE POVERTY AMONG 18-24 YEAR OLDS
59.1/ 100
METRIC RATING
168th/ 347
METRIC RANK
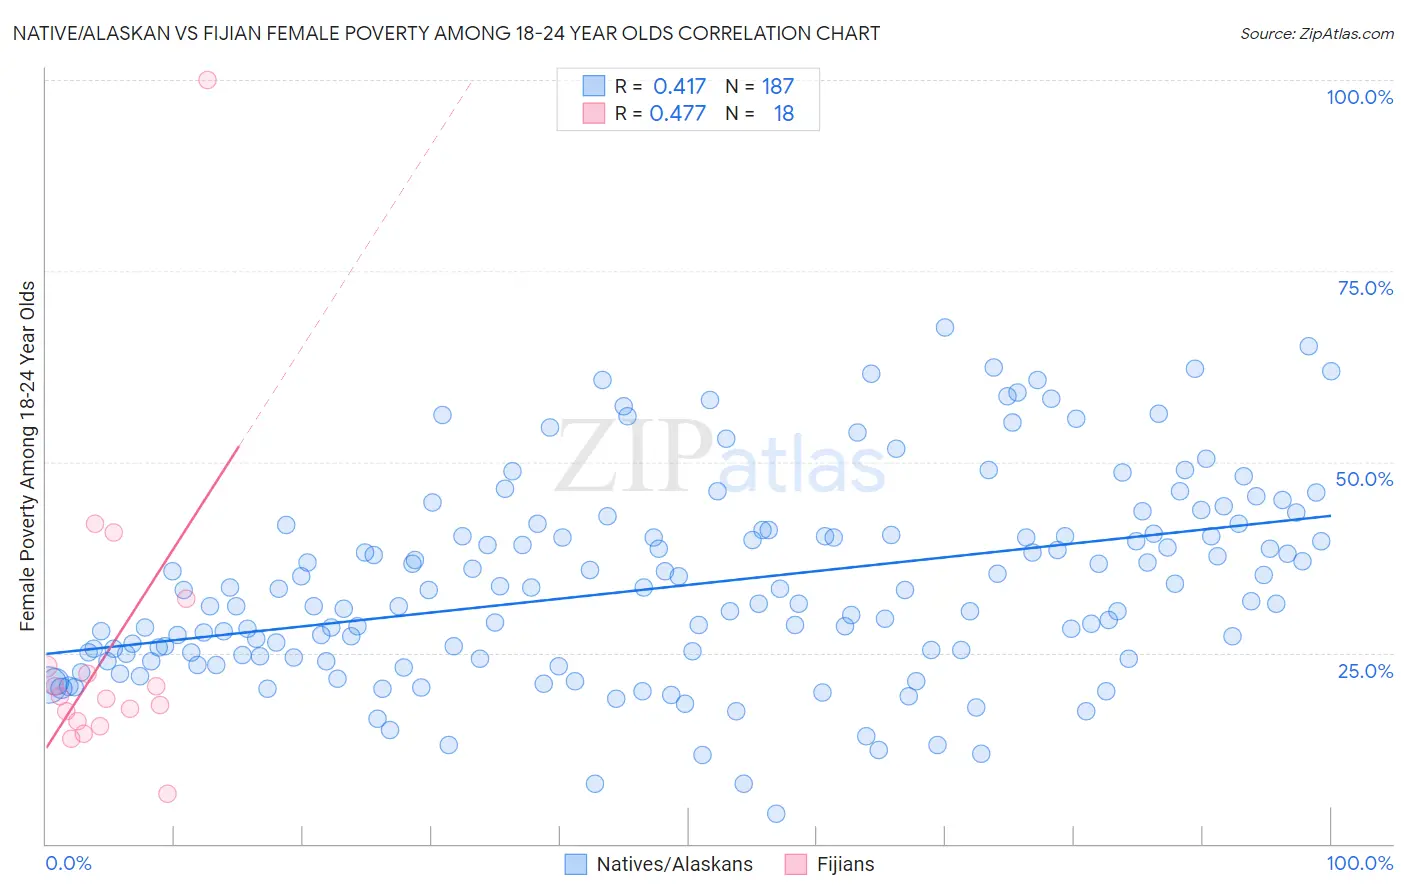
Native/Alaskan vs Fijian Female Poverty Among 18-24 Year Olds Correlation Chart
The statistical analysis conducted on geographies consisting of 494,517,796 people shows a moderate positive correlation between the proportion of Natives/Alaskans and poverty level among females between the ages 18 and 24 in the United States with a correlation coefficient (R) of 0.417 and weighted average of 25.4%. Similarly, the statistical analysis conducted on geographies consisting of 55,734,128 people shows a moderate positive correlation between the proportion of Fijians and poverty level among females between the ages 18 and 24 in the United States with a correlation coefficient (R) of 0.477 and weighted average of 20.0%, a difference of 27.0%.
Female Poverty Among 18-24 Year Olds Correlation Summary
| Measurement | Native/Alaskan | Fijian |
| Minimum | 4.0% | 6.5% |
| Maximum | 67.6% | 100.0% |
| Range | 63.6% | 93.5% |
| Mean | 33.8% | 25.5% |
| Median | 31.8% | 19.1% |
| Interquartile 25% (IQ1) | 24.6% | 16.1% |
| Interquartile 75% (IQ3) | 40.4% | 23.3% |
| Interquartile Range (IQR) | 15.9% | 7.2% |
| Standard Deviation (Sample) | 12.9% | 20.6% |
| Standard Deviation (Population) | 12.8% | 20.1% |
Similar Demographics by Female Poverty Among 18-24 Year Olds
Demographics Similar to Natives/Alaskans by Female Poverty Among 18-24 Year Olds
In terms of female poverty among 18-24 year olds, the demographic groups most similar to Natives/Alaskans are Ute (25.4%, a difference of 0.050%), Yakama (25.3%, a difference of 0.29%), Immigrants from Saudi Arabia (25.3%, a difference of 0.54%), German Russian (25.2%, a difference of 0.97%), and Arapaho (25.2%, a difference of 1.0%).
| Demographics | Rating | Rank | Female Poverty Among 18-24 Year Olds |
| Immigrants | Zaire | 0.0 /100 | #321 | Tragic 25.1% |
| Somalis | 0.0 /100 | #322 | Tragic 25.1% |
| Arapaho | 0.0 /100 | #323 | Tragic 25.2% |
| German Russians | 0.0 /100 | #324 | Tragic 25.2% |
| Immigrants | Saudi Arabia | 0.0 /100 | #325 | Tragic 25.3% |
| Yakama | 0.0 /100 | #326 | Tragic 25.3% |
| Ute | 0.0 /100 | #327 | Tragic 25.4% |
| Natives/Alaskans | 0.0 /100 | #328 | Tragic 25.4% |
| Cajuns | 0.0 /100 | #329 | Tragic 25.7% |
| Immigrants | Somalia | 0.0 /100 | #330 | Tragic 25.7% |
| Chippewa | 0.0 /100 | #331 | Tragic 25.9% |
| Houma | 0.0 /100 | #332 | Tragic 26.2% |
| Apache | 0.0 /100 | #333 | Tragic 26.3% |
| Pueblo | 0.0 /100 | #334 | Tragic 26.9% |
| Yup'ik | 0.0 /100 | #335 | Tragic 27.0% |
Demographics Similar to Fijians by Female Poverty Among 18-24 Year Olds
In terms of female poverty among 18-24 year olds, the demographic groups most similar to Fijians are Czechoslovakian (20.0%, a difference of 0.14%), Hmong (20.0%, a difference of 0.19%), Iranian (20.1%, a difference of 0.22%), Immigrants from Nigeria (20.1%, a difference of 0.24%), and Belizean (20.1%, a difference of 0.35%).
| Demographics | Rating | Rank | Female Poverty Among 18-24 Year Olds |
| Immigrants | Belize | 74.1 /100 | #161 | Good 19.8% |
| French Canadians | 73.0 /100 | #162 | Good 19.9% |
| Malaysians | 72.7 /100 | #163 | Good 19.9% |
| Central Americans | 70.0 /100 | #164 | Good 19.9% |
| Eastern Europeans | 69.3 /100 | #165 | Good 19.9% |
| Belgians | 69.1 /100 | #166 | Good 19.9% |
| Czechoslovakians | 61.8 /100 | #167 | Good 20.0% |
| Fijians | 59.1 /100 | #168 | Average 20.0% |
| Hmong | 55.4 /100 | #169 | Average 20.0% |
| Iranians | 54.7 /100 | #170 | Average 20.1% |
| Immigrants | Nigeria | 54.3 /100 | #171 | Average 20.1% |
| Belizeans | 52.0 /100 | #172 | Average 20.1% |
| Irish | 50.0 /100 | #173 | Average 20.1% |
| Swedes | 50.0 /100 | #174 | Average 20.1% |
| South American Indians | 48.4 /100 | #175 | Average 20.1% |