Immigrants from Sri Lanka vs Macedonian Seniors Poverty Over the Age of 65
COMPARE
Immigrants from Sri Lanka
Macedonian
Seniors Poverty Over the Age of 65
Seniors Poverty Over the Age of 65 Comparison
Immigrants from Sri Lanka
Macedonians
10.1%
SENIORS POVERTY OVER THE AGE OF 65
97.3/ 100
METRIC RATING
81st/ 347
METRIC RANK
9.9%
SENIORS POVERTY OVER THE AGE OF 65
98.8/ 100
METRIC RATING
63rd/ 347
METRIC RANK
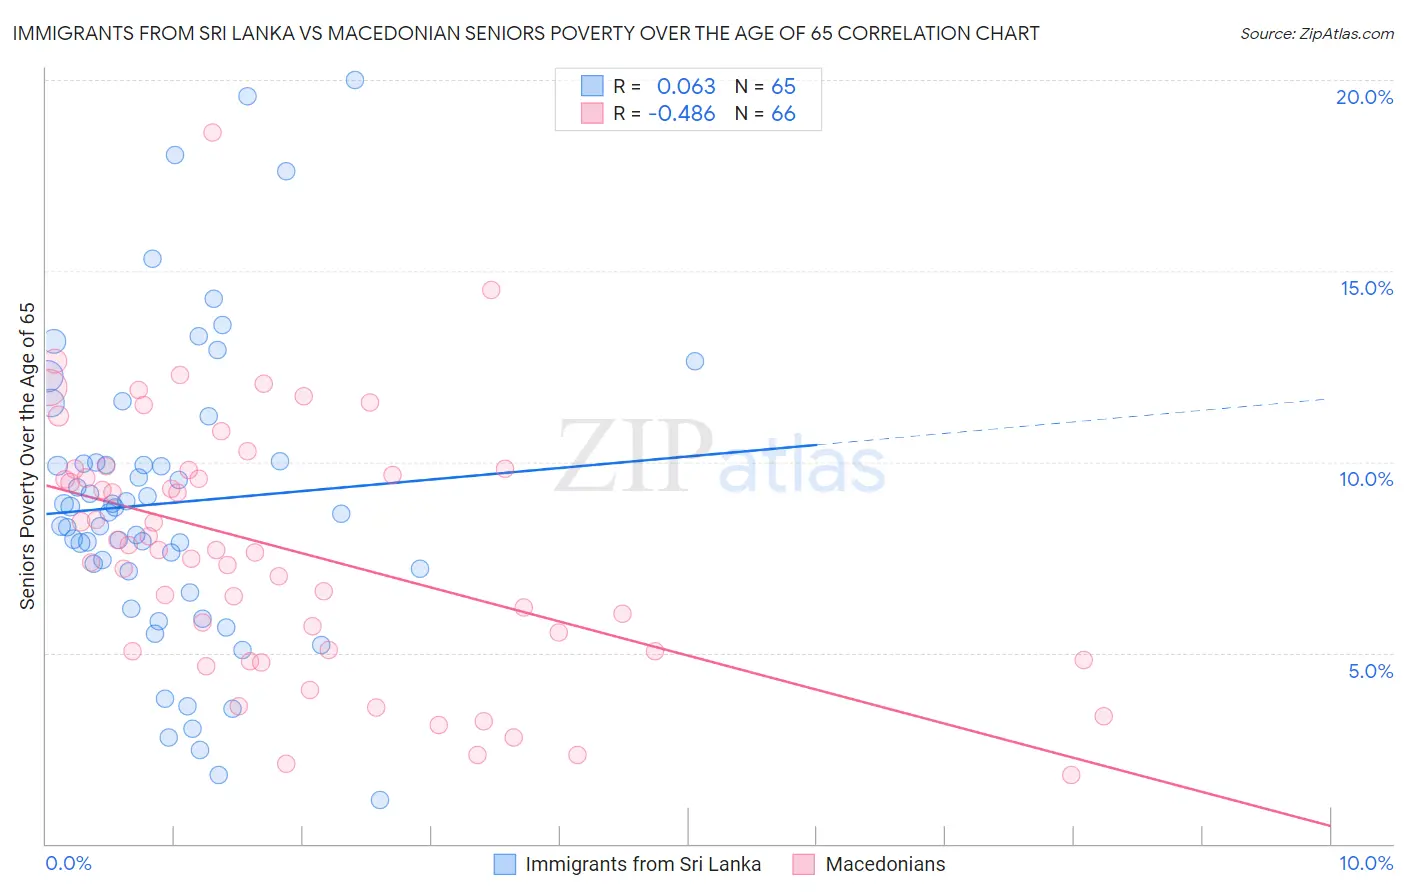
Immigrants from Sri Lanka vs Macedonian Seniors Poverty Over the Age of 65 Correlation Chart
The statistical analysis conducted on geographies consisting of 149,599,044 people shows a slight positive correlation between the proportion of Immigrants from Sri Lanka and poverty level among seniors over the age of 65 in the United States with a correlation coefficient (R) of 0.063 and weighted average of 10.1%. Similarly, the statistical analysis conducted on geographies consisting of 132,515,092 people shows a moderate negative correlation between the proportion of Macedonians and poverty level among seniors over the age of 65 in the United States with a correlation coefficient (R) of -0.486 and weighted average of 9.9%, a difference of 2.1%.
Seniors Poverty Over the Age of 65 Correlation Summary
| Measurement | Immigrants from Sri Lanka | Macedonian |
| Minimum | 1.1% | 1.8% |
| Maximum | 20.0% | 18.6% |
| Range | 18.9% | 16.8% |
| Mean | 8.9% | 7.7% |
| Median | 8.7% | 7.7% |
| Interquartile 25% (IQ1) | 6.9% | 5.0% |
| Interquartile 75% (IQ3) | 10.0% | 9.8% |
| Interquartile Range (IQR) | 3.1% | 4.7% |
| Standard Deviation (Sample) | 4.0% | 3.3% |
| Standard Deviation (Population) | 3.9% | 3.3% |
Demographics Similar to Immigrants from Sri Lanka and Macedonians by Seniors Poverty Over the Age of 65
In terms of seniors poverty over the age of 65, the demographic groups most similar to Immigrants from Sri Lanka are Korean (10.1%, a difference of 0.030%), Immigrants from Bolivia (10.1%, a difference of 0.070%), Immigrants from Ireland (10.0%, a difference of 0.13%), White/Caucasian (10.0%, a difference of 0.14%), and Immigrants from South Africa (10.0%, a difference of 0.38%). Similarly, the demographic groups most similar to Macedonians are Immigrants from North America (9.9%, a difference of 0.050%), French Canadian (9.8%, a difference of 0.18%), Pennsylvania German (9.9%, a difference of 0.33%), Immigrants from Netherlands (9.9%, a difference of 0.38%), and Immigrants from Austria (9.9%, a difference of 0.49%).
| Demographics | Rating | Rank | Seniors Poverty Over the Age of 65 |
| French Canadians | 98.9 /100 | #62 | Exceptional 9.8% |
| Macedonians | 98.8 /100 | #63 | Exceptional 9.9% |
| Immigrants | North America | 98.8 /100 | #64 | Exceptional 9.9% |
| Pennsylvania Germans | 98.7 /100 | #65 | Exceptional 9.9% |
| Immigrants | Netherlands | 98.7 /100 | #66 | Exceptional 9.9% |
| Immigrants | Austria | 98.6 /100 | #67 | Exceptional 9.9% |
| Canadians | 98.5 /100 | #68 | Exceptional 9.9% |
| Australians | 98.4 /100 | #69 | Exceptional 9.9% |
| Samoans | 98.0 /100 | #70 | Exceptional 10.0% |
| Yugoslavians | 97.9 /100 | #71 | Exceptional 10.0% |
| Palestinians | 97.9 /100 | #72 | Exceptional 10.0% |
| Russians | 97.9 /100 | #73 | Exceptional 10.0% |
| Turks | 97.9 /100 | #74 | Exceptional 10.0% |
| Immigrants | Czechoslovakia | 97.8 /100 | #75 | Exceptional 10.0% |
| New Zealanders | 97.7 /100 | #76 | Exceptional 10.0% |
| Immigrants | South Africa | 97.7 /100 | #77 | Exceptional 10.0% |
| Whites/Caucasians | 97.5 /100 | #78 | Exceptional 10.0% |
| Immigrants | Ireland | 97.5 /100 | #79 | Exceptional 10.0% |
| Koreans | 97.4 /100 | #80 | Exceptional 10.1% |
| Immigrants | Sri Lanka | 97.3 /100 | #81 | Exceptional 10.1% |
| Immigrants | Bolivia | 97.3 /100 | #82 | Exceptional 10.1% |