Vietnamese vs Macedonian Seniors Poverty Over the Age of 65
COMPARE
Vietnamese
Macedonian
Seniors Poverty Over the Age of 65
Seniors Poverty Over the Age of 65 Comparison
Vietnamese
Macedonians
14.0%
SENIORS POVERTY OVER THE AGE OF 65
0.0/ 100
METRIC RATING
297th/ 347
METRIC RANK
9.9%
SENIORS POVERTY OVER THE AGE OF 65
98.8/ 100
METRIC RATING
63rd/ 347
METRIC RANK
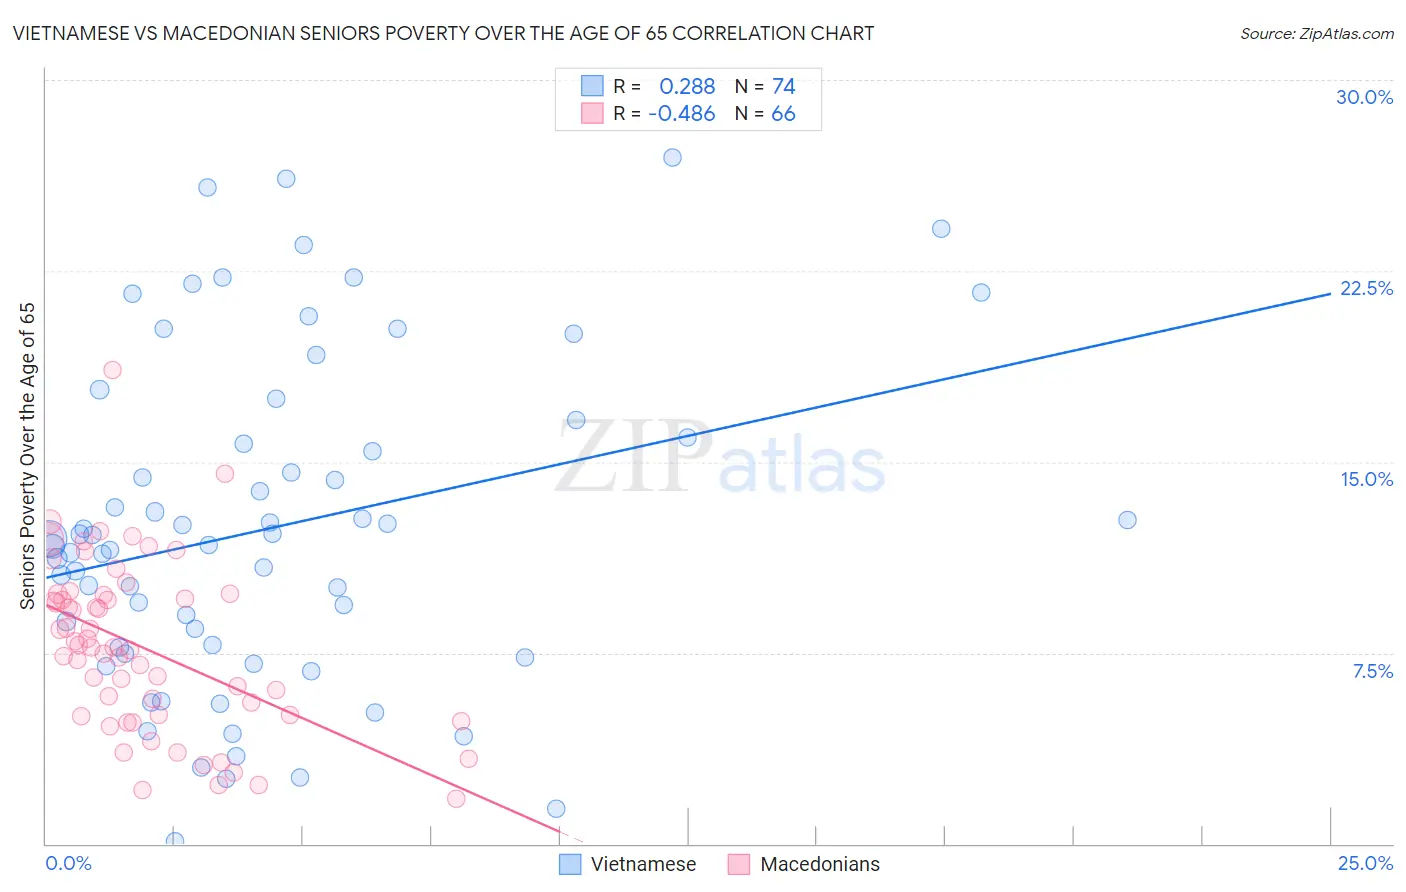
Vietnamese vs Macedonian Seniors Poverty Over the Age of 65 Correlation Chart
The statistical analysis conducted on geographies consisting of 170,418,192 people shows a weak positive correlation between the proportion of Vietnamese and poverty level among seniors over the age of 65 in the United States with a correlation coefficient (R) of 0.288 and weighted average of 14.0%. Similarly, the statistical analysis conducted on geographies consisting of 132,515,092 people shows a moderate negative correlation between the proportion of Macedonians and poverty level among seniors over the age of 65 in the United States with a correlation coefficient (R) of -0.486 and weighted average of 9.9%, a difference of 41.6%.
Seniors Poverty Over the Age of 65 Correlation Summary
| Measurement | Vietnamese | Macedonian |
| Minimum | 0.093% | 1.8% |
| Maximum | 27.0% | 18.6% |
| Range | 26.9% | 16.8% |
| Mean | 12.4% | 7.7% |
| Median | 11.9% | 7.7% |
| Interquartile 25% (IQ1) | 7.7% | 5.0% |
| Interquartile 75% (IQ3) | 15.9% | 9.8% |
| Interquartile Range (IQR) | 8.2% | 4.7% |
| Standard Deviation (Sample) | 6.4% | 3.3% |
| Standard Deviation (Population) | 6.4% | 3.3% |
Similar Demographics by Seniors Poverty Over the Age of 65
Demographics Similar to Vietnamese by Seniors Poverty Over the Age of 65
In terms of seniors poverty over the age of 65, the demographic groups most similar to Vietnamese are Immigrants from Jamaica (13.9%, a difference of 0.070%), Immigrants from Belize (14.0%, a difference of 0.28%), Apache (13.9%, a difference of 0.34%), Ecuadorian (14.0%, a difference of 0.35%), and Immigrants from Uzbekistan (14.0%, a difference of 0.43%).
| Demographics | Rating | Rank | Seniors Poverty Over the Age of 65 |
| Immigrants | Central America | 0.0 /100 | #290 | Tragic 13.6% |
| Blacks/African Americans | 0.0 /100 | #291 | Tragic 13.7% |
| Spanish American Indians | 0.0 /100 | #292 | Tragic 13.8% |
| Immigrants | Guatemala | 0.0 /100 | #293 | Tragic 13.8% |
| Cheyenne | 0.0 /100 | #294 | Tragic 13.9% |
| Apache | 0.0 /100 | #295 | Tragic 13.9% |
| Immigrants | Jamaica | 0.0 /100 | #296 | Tragic 13.9% |
| Vietnamese | 0.0 /100 | #297 | Tragic 14.0% |
| Immigrants | Belize | 0.0 /100 | #298 | Tragic 14.0% |
| Ecuadorians | 0.0 /100 | #299 | Tragic 14.0% |
| Immigrants | Uzbekistan | 0.0 /100 | #300 | Tragic 14.0% |
| U.S. Virgin Islanders | 0.0 /100 | #301 | Tragic 14.0% |
| Yup'ik | 0.0 /100 | #302 | Tragic 14.1% |
| Immigrants | Bangladesh | 0.0 /100 | #303 | Tragic 14.1% |
| West Indians | 0.0 /100 | #304 | Tragic 14.1% |
Demographics Similar to Macedonians by Seniors Poverty Over the Age of 65
In terms of seniors poverty over the age of 65, the demographic groups most similar to Macedonians are Immigrants from North America (9.9%, a difference of 0.050%), French Canadian (9.8%, a difference of 0.18%), Iranian (9.8%, a difference of 0.22%), Celtic (9.8%, a difference of 0.31%), and Pennsylvania German (9.9%, a difference of 0.33%).
| Demographics | Rating | Rank | Seniors Poverty Over the Age of 65 |
| Immigrants | England | 99.1 /100 | #56 | Exceptional 9.8% |
| Bolivians | 99.1 /100 | #57 | Exceptional 9.8% |
| Serbians | 99.1 /100 | #58 | Exceptional 9.8% |
| Immigrants | Canada | 99.0 /100 | #59 | Exceptional 9.8% |
| Celtics | 99.0 /100 | #60 | Exceptional 9.8% |
| Iranians | 98.9 /100 | #61 | Exceptional 9.8% |
| French Canadians | 98.9 /100 | #62 | Exceptional 9.8% |
| Macedonians | 98.8 /100 | #63 | Exceptional 9.9% |
| Immigrants | North America | 98.8 /100 | #64 | Exceptional 9.9% |
| Pennsylvania Germans | 98.7 /100 | #65 | Exceptional 9.9% |
| Immigrants | Netherlands | 98.7 /100 | #66 | Exceptional 9.9% |
| Immigrants | Austria | 98.6 /100 | #67 | Exceptional 9.9% |
| Canadians | 98.5 /100 | #68 | Exceptional 9.9% |
| Australians | 98.4 /100 | #69 | Exceptional 9.9% |
| Samoans | 98.0 /100 | #70 | Exceptional 10.0% |