Cambodian vs Japanese 3rd Grade
COMPARE
Cambodian
Japanese
3rd Grade
3rd Grade Comparison
Cambodians
Japanese
97.9%
3RD GRADE
88.1/ 100
METRIC RATING
135th/ 347
METRIC RANK
96.4%
3RD GRADE
0.0/ 100
METRIC RATING
327th/ 347
METRIC RANK
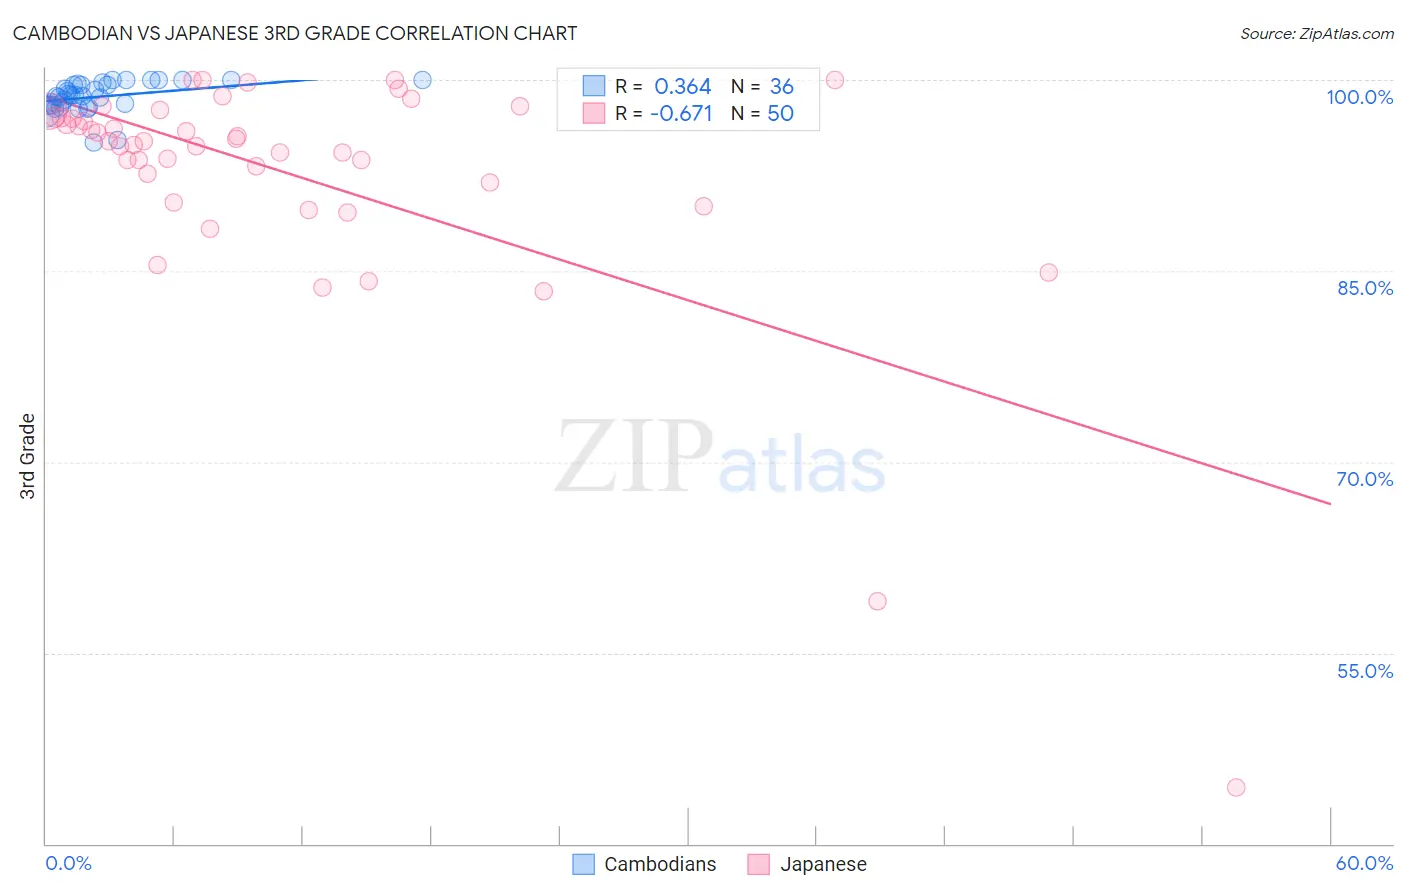
Cambodian vs Japanese 3rd Grade Correlation Chart
The statistical analysis conducted on geographies consisting of 102,511,743 people shows a mild positive correlation between the proportion of Cambodians and percentage of population with at least 3rd grade education in the United States with a correlation coefficient (R) of 0.364 and weighted average of 97.9%. Similarly, the statistical analysis conducted on geographies consisting of 249,183,224 people shows a significant negative correlation between the proportion of Japanese and percentage of population with at least 3rd grade education in the United States with a correlation coefficient (R) of -0.671 and weighted average of 96.4%, a difference of 1.6%.
3rd Grade Correlation Summary
| Measurement | Cambodian | Japanese |
| Minimum | 95.1% | 44.4% |
| Maximum | 100.0% | 100.0% |
| Range | 4.9% | 55.6% |
| Mean | 98.7% | 92.7% |
| Median | 98.8% | 95.2% |
| Interquartile 25% (IQ1) | 98.0% | 92.0% |
| Interquartile 75% (IQ3) | 99.7% | 97.1% |
| Interquartile Range (IQR) | 1.6% | 5.1% |
| Standard Deviation (Sample) | 1.2% | 9.6% |
| Standard Deviation (Population) | 1.2% | 9.5% |
Similar Demographics by 3rd Grade
Demographics Similar to Cambodians by 3rd Grade
In terms of 3rd grade, the demographic groups most similar to Cambodians are Immigrants from Kuwait (97.9%, a difference of 0.0%), Seminole (97.9%, a difference of 0.0%), Spaniard (97.9%, a difference of 0.0%), Immigrants from Romania (97.9%, a difference of 0.0%), and Immigrants from Bulgaria (97.9%, a difference of 0.010%).
| Demographics | Rating | Rank | 3rd Grade |
| Colville | 92.1 /100 | #128 | Exceptional 98.0% |
| Immigrants | Serbia | 91.9 /100 | #129 | Exceptional 98.0% |
| Immigrants | Europe | 91.2 /100 | #130 | Exceptional 98.0% |
| Immigrants | Bulgaria | 89.1 /100 | #131 | Excellent 97.9% |
| Immigrants | Hungary | 88.8 /100 | #132 | Excellent 97.9% |
| Immigrants | Kuwait | 88.7 /100 | #133 | Excellent 97.9% |
| Seminole | 88.7 /100 | #134 | Excellent 97.9% |
| Cambodians | 88.1 /100 | #135 | Excellent 97.9% |
| Spaniards | 87.9 /100 | #136 | Excellent 97.9% |
| Immigrants | Romania | 87.9 /100 | #137 | Excellent 97.9% |
| Israelis | 86.6 /100 | #138 | Excellent 97.9% |
| Blackfeet | 86.3 /100 | #139 | Excellent 97.9% |
| Palestinians | 84.6 /100 | #140 | Excellent 97.9% |
| Immigrants | Turkey | 83.5 /100 | #141 | Excellent 97.9% |
| Hmong | 80.3 /100 | #142 | Excellent 97.9% |
Demographics Similar to Japanese by 3rd Grade
In terms of 3rd grade, the demographic groups most similar to Japanese are Immigrants from Vietnam (96.4%, a difference of 0.010%), Bangladeshi (96.3%, a difference of 0.010%), Immigrants from Honduras (96.3%, a difference of 0.020%), Mexican American Indian (96.4%, a difference of 0.040%), and Dominican (96.4%, a difference of 0.060%).
| Demographics | Rating | Rank | 3rd Grade |
| Immigrants | Nicaragua | 0.0 /100 | #320 | Tragic 96.5% |
| Indonesians | 0.0 /100 | #321 | Tragic 96.5% |
| Immigrants | Belize | 0.0 /100 | #322 | Tragic 96.5% |
| Hondurans | 0.0 /100 | #323 | Tragic 96.5% |
| Dominicans | 0.0 /100 | #324 | Tragic 96.4% |
| Mexican American Indians | 0.0 /100 | #325 | Tragic 96.4% |
| Immigrants | Vietnam | 0.0 /100 | #326 | Tragic 96.4% |
| Japanese | 0.0 /100 | #327 | Tragic 96.4% |
| Bangladeshis | 0.0 /100 | #328 | Tragic 96.3% |
| Immigrants | Honduras | 0.0 /100 | #329 | Tragic 96.3% |
| Immigrants | Armenia | 0.0 /100 | #330 | Tragic 96.3% |
| Immigrants | Latin America | 0.0 /100 | #331 | Tragic 96.2% |
| Mexicans | 0.0 /100 | #332 | Tragic 96.2% |
| Immigrants | Fiji | 0.0 /100 | #333 | Tragic 96.2% |
| Immigrants | Cambodia | 0.0 /100 | #334 | Tragic 96.2% |