Seminole vs Immigrants from Trinidad and Tobago Single Father Poverty
COMPARE
Seminole
Immigrants from Trinidad and Tobago
Single Father Poverty
Single Father Poverty Comparison
Seminole
Immigrants from Trinidad and Tobago
18.1%
SINGLE FATHER POVERTY
0.0/ 100
METRIC RATING
296th/ 347
METRIC RANK
16.8%
SINGLE FATHER POVERTY
4.5/ 100
METRIC RATING
230th/ 347
METRIC RANK
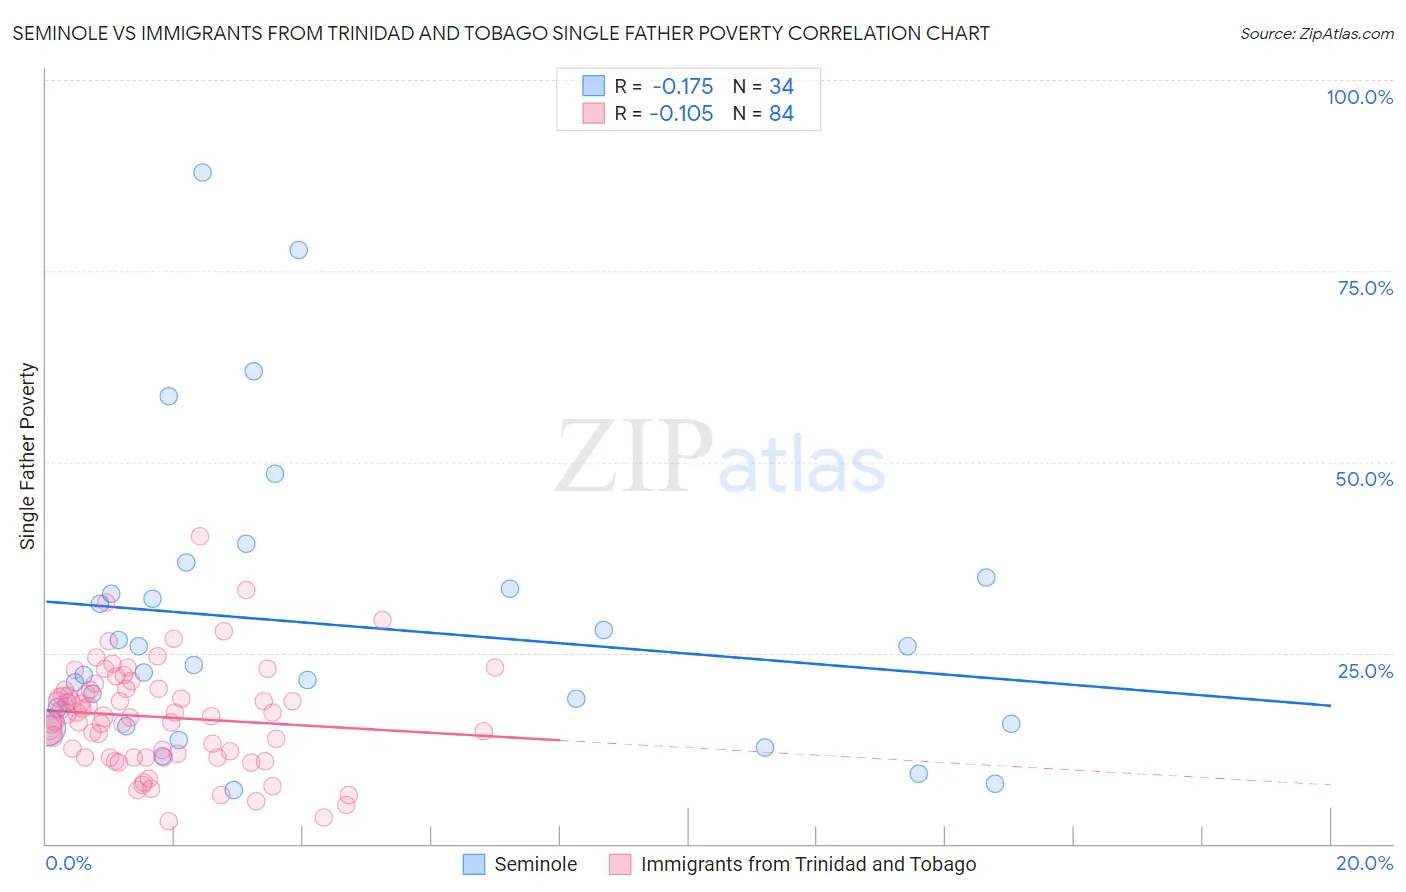
Seminole vs Immigrants from Trinidad and Tobago Single Father Poverty Correlation Chart
The statistical analysis conducted on geographies consisting of 108,241,513 people shows a poor negative correlation between the proportion of Seminole and poverty level among single fathers in the United States with a correlation coefficient (R) of -0.175 and weighted average of 18.1%. Similarly, the statistical analysis conducted on geographies consisting of 189,683,787 people shows a poor negative correlation between the proportion of Immigrants from Trinidad and Tobago and poverty level among single fathers in the United States with a correlation coefficient (R) of -0.105 and weighted average of 16.8%, a difference of 7.7%.
Single Father Poverty Correlation Summary
| Measurement | Seminole | Immigrants from Trinidad and Tobago |
| Minimum | 7.0% | 3.0% |
| Maximum | 87.9% | 40.2% |
| Range | 80.9% | 37.3% |
| Mean | 28.7% | 16.6% |
| Median | 22.9% | 16.7% |
| Interquartile 25% (IQ1) | 15.8% | 11.4% |
| Interquartile 75% (IQ3) | 33.3% | 20.2% |
| Interquartile Range (IQR) | 17.5% | 8.9% |
| Standard Deviation (Sample) | 18.9% | 6.8% |
| Standard Deviation (Population) | 18.6% | 6.8% |
Similar Demographics by Single Father Poverty
Demographics Similar to Seminole by Single Father Poverty
In terms of single father poverty, the demographic groups most similar to Seminole are Yakama (18.1%, a difference of 0.10%), U.S. Virgin Islander (18.1%, a difference of 0.17%), Alaska Native (18.1%, a difference of 0.19%), French (18.2%, a difference of 0.21%), and Immigrants from Bahamas (18.1%, a difference of 0.30%).
| Demographics | Rating | Rank | Single Father Poverty |
| Irish | 0.0 /100 | #289 | Tragic 18.0% |
| West Indians | 0.0 /100 | #290 | Tragic 18.0% |
| Alaskan Athabascans | 0.0 /100 | #291 | Tragic 18.1% |
| Immigrants | Bahamas | 0.0 /100 | #292 | Tragic 18.1% |
| Alaska Natives | 0.0 /100 | #293 | Tragic 18.1% |
| U.S. Virgin Islanders | 0.0 /100 | #294 | Tragic 18.1% |
| Yakama | 0.0 /100 | #295 | Tragic 18.1% |
| Seminole | 0.0 /100 | #296 | Tragic 18.1% |
| French | 0.0 /100 | #297 | Tragic 18.2% |
| Africans | 0.0 /100 | #298 | Tragic 18.3% |
| Whites/Caucasians | 0.0 /100 | #299 | Tragic 18.4% |
| Immigrants | Dominican Republic | 0.0 /100 | #300 | Tragic 18.4% |
| Hungarians | 0.0 /100 | #301 | Tragic 18.5% |
| Comanche | 0.0 /100 | #302 | Tragic 18.5% |
| Celtics | 0.0 /100 | #303 | Tragic 18.5% |
Demographics Similar to Immigrants from Trinidad and Tobago by Single Father Poverty
In terms of single father poverty, the demographic groups most similar to Immigrants from Trinidad and Tobago are Israeli (16.8%, a difference of 0.030%), Belgian (16.8%, a difference of 0.19%), Spanish American (16.9%, a difference of 0.21%), Immigrants from Grenada (16.9%, a difference of 0.23%), and British (16.8%, a difference of 0.26%).
| Demographics | Rating | Rank | Single Father Poverty |
| Immigrants | Austria | 7.0 /100 | #223 | Tragic 16.8% |
| Immigrants | Norway | 6.5 /100 | #224 | Tragic 16.8% |
| Menominee | 6.4 /100 | #225 | Tragic 16.8% |
| Hispanics or Latinos | 6.1 /100 | #226 | Tragic 16.8% |
| British | 5.6 /100 | #227 | Tragic 16.8% |
| Belgians | 5.3 /100 | #228 | Tragic 16.8% |
| Israelis | 4.6 /100 | #229 | Tragic 16.8% |
| Immigrants | Trinidad and Tobago | 4.5 /100 | #230 | Tragic 16.8% |
| Spanish Americans | 3.7 /100 | #231 | Tragic 16.9% |
| Immigrants | Grenada | 3.7 /100 | #232 | Tragic 16.9% |
| Senegalese | 3.2 /100 | #233 | Tragic 16.9% |
| Marshallese | 3.1 /100 | #234 | Tragic 16.9% |
| Immigrants | Western Europe | 2.9 /100 | #235 | Tragic 16.9% |
| Immigrants | Germany | 2.9 /100 | #236 | Tragic 16.9% |
| Sub-Saharan Africans | 2.9 /100 | #237 | Tragic 16.9% |