Bulgarian vs Indian (Asian) Single Mother Poverty
COMPARE
Bulgarian
Indian (Asian)
Single Mother Poverty
Single Mother Poverty Comparison
Bulgarians
Indians (Asian)
26.5%
SINGLE MOTHER POVERTY
99.9/ 100
METRIC RATING
33rd/ 347
METRIC RANK
25.8%
SINGLE MOTHER POVERTY
100.0/ 100
METRIC RATING
13th/ 347
METRIC RANK
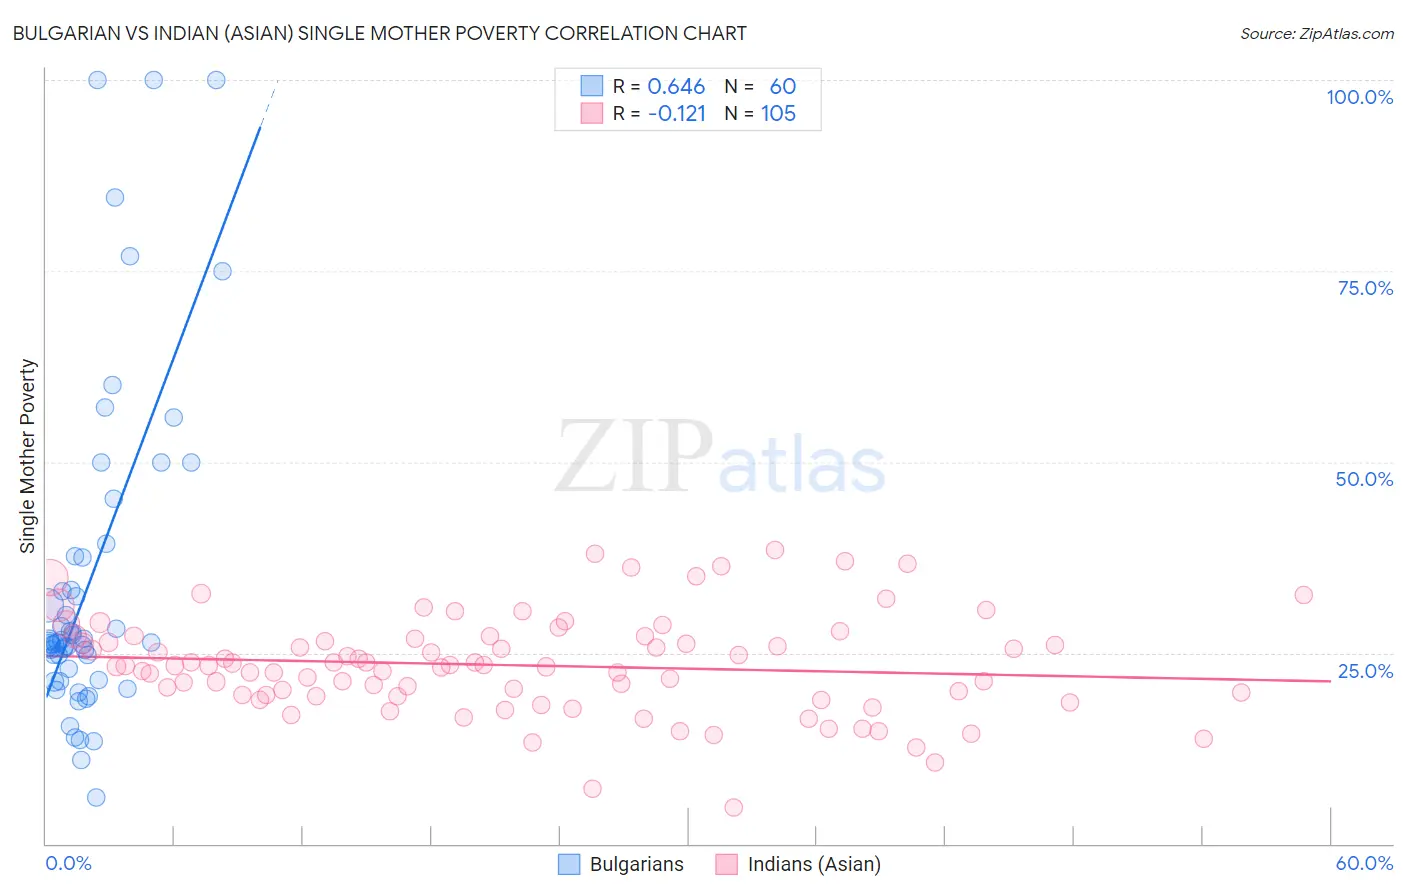
Bulgarian vs Indian (Asian) Single Mother Poverty Correlation Chart
The statistical analysis conducted on geographies consisting of 202,203,367 people shows a significant positive correlation between the proportion of Bulgarians and poverty level among single mothers in the United States with a correlation coefficient (R) of 0.646 and weighted average of 26.5%. Similarly, the statistical analysis conducted on geographies consisting of 477,542,737 people shows a poor negative correlation between the proportion of Indians (Asian) and poverty level among single mothers in the United States with a correlation coefficient (R) of -0.121 and weighted average of 25.8%, a difference of 3.1%.
Single Mother Poverty Correlation Summary
| Measurement | Bulgarian | Indian (Asian) |
| Minimum | 6.1% | 4.7% |
| Maximum | 100.0% | 38.5% |
| Range | 93.9% | 33.7% |
| Mean | 34.4% | 23.4% |
| Median | 26.4% | 23.3% |
| Interquartile 25% (IQ1) | 22.1% | 19.4% |
| Interquartile 75% (IQ3) | 37.5% | 27.0% |
| Interquartile Range (IQR) | 15.4% | 7.6% |
| Standard Deviation (Sample) | 21.8% | 6.5% |
| Standard Deviation (Population) | 21.6% | 6.4% |
Demographics Similar to Bulgarians and Indians (Asian) by Single Mother Poverty
In terms of single mother poverty, the demographic groups most similar to Bulgarians are Tongan (26.5%, a difference of 0.040%), Immigrants from Philippines (26.5%, a difference of 0.28%), Turkish (26.4%, a difference of 0.44%), Jordanian (26.4%, a difference of 0.53%), and Korean (26.4%, a difference of 0.58%). Similarly, the demographic groups most similar to Indians (Asian) are Immigrants from Singapore (25.8%, a difference of 0.15%), Immigrants from Ireland (25.8%, a difference of 0.34%), Bolivian (25.9%, a difference of 0.62%), Asian (26.0%, a difference of 0.81%), and Immigrants from Pakistan (26.0%, a difference of 1.1%).
| Demographics | Rating | Rank | Single Mother Poverty |
| Indians (Asian) | 100.0 /100 | #13 | Exceptional 25.8% |
| Immigrants | Singapore | 100.0 /100 | #14 | Exceptional 25.8% |
| Immigrants | Ireland | 100.0 /100 | #15 | Exceptional 25.8% |
| Bolivians | 100.0 /100 | #16 | Exceptional 25.9% |
| Asians | 100.0 /100 | #17 | Exceptional 26.0% |
| Immigrants | Pakistan | 100.0 /100 | #18 | Exceptional 26.0% |
| Immigrants | Eastern Asia | 100.0 /100 | #19 | Exceptional 26.1% |
| Immigrants | China | 100.0 /100 | #20 | Exceptional 26.1% |
| Immigrants | Bolivia | 100.0 /100 | #21 | Exceptional 26.2% |
| Immigrants | Korea | 100.0 /100 | #22 | Exceptional 26.2% |
| Burmese | 100.0 /100 | #23 | Exceptional 26.2% |
| Immigrants | Moldova | 100.0 /100 | #24 | Exceptional 26.2% |
| Immigrants | Asia | 100.0 /100 | #25 | Exceptional 26.3% |
| Immigrants | Sri Lanka | 100.0 /100 | #26 | Exceptional 26.3% |
| Immigrants | Japan | 100.0 /100 | #27 | Exceptional 26.4% |
| Koreans | 100.0 /100 | #28 | Exceptional 26.4% |
| Jordanians | 100.0 /100 | #29 | Exceptional 26.4% |
| Turks | 100.0 /100 | #30 | Exceptional 26.4% |
| Immigrants | Philippines | 100.0 /100 | #31 | Exceptional 26.5% |
| Tongans | 99.9 /100 | #32 | Exceptional 26.5% |
| Bulgarians | 99.9 /100 | #33 | Exceptional 26.5% |