Bulgarian vs Spaniard Family Poverty
COMPARE
Bulgarian
Spaniard
Family Poverty
Family Poverty Comparison
Bulgarians
Spaniards
7.1%
FAMILY POVERTY
99.8/ 100
METRIC RATING
10th/ 347
METRIC RANK
9.4%
FAMILY POVERTY
22.8/ 100
METRIC RATING
199th/ 347
METRIC RANK
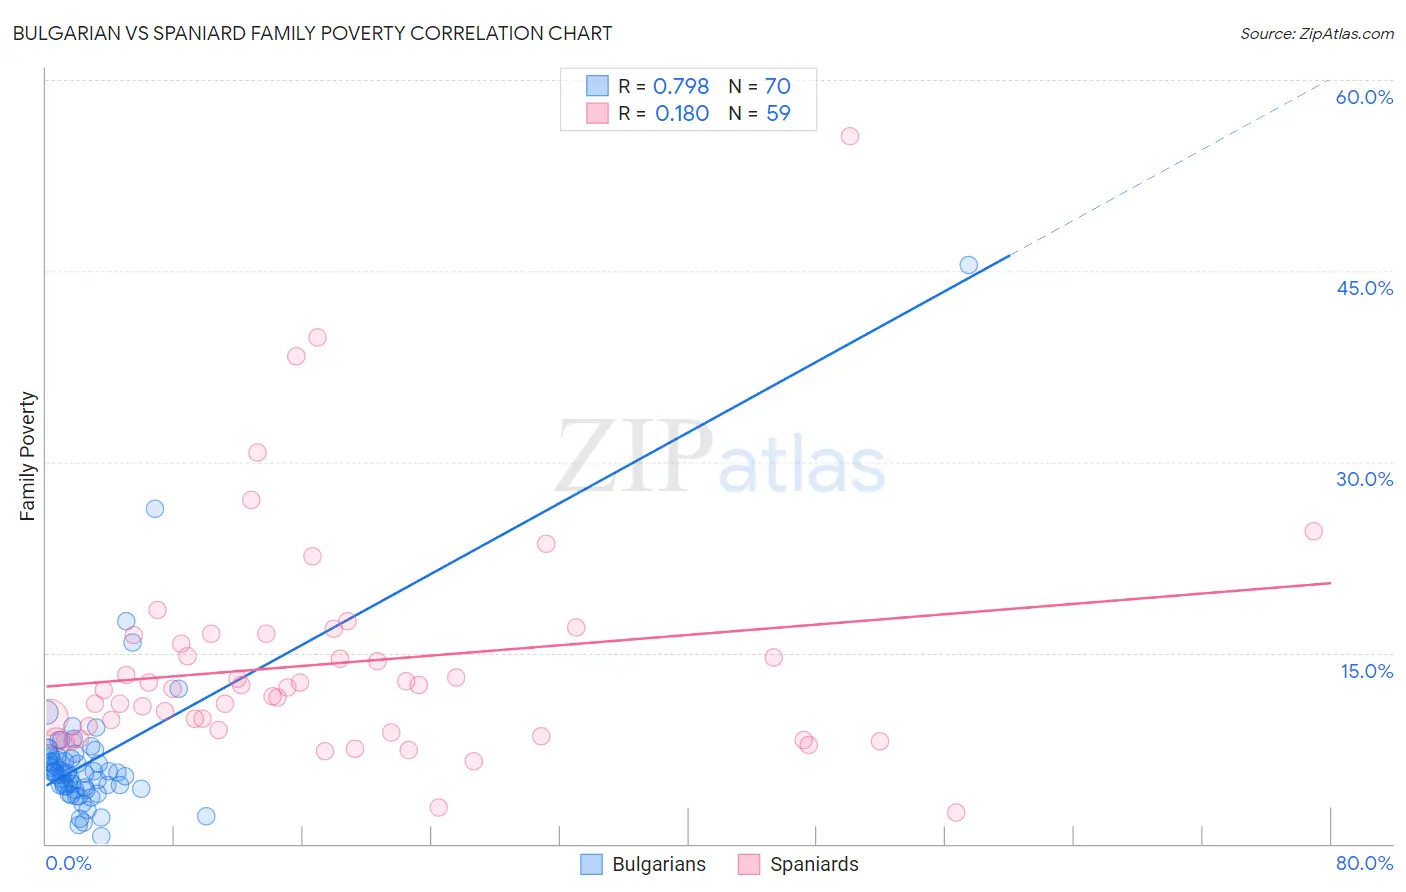
Bulgarian vs Spaniard Family Poverty Correlation Chart
The statistical analysis conducted on geographies consisting of 205,316,077 people shows a strong positive correlation between the proportion of Bulgarians and poverty level among families in the United States with a correlation coefficient (R) of 0.798 and weighted average of 7.1%. Similarly, the statistical analysis conducted on geographies consisting of 441,991,510 people shows a poor positive correlation between the proportion of Spaniards and poverty level among families in the United States with a correlation coefficient (R) of 0.180 and weighted average of 9.4%, a difference of 32.0%.
Family Poverty Correlation Summary
| Measurement | Bulgarian | Spaniard |
| Minimum | 0.55% | 2.5% |
| Maximum | 45.5% | 55.6% |
| Range | 44.9% | 53.1% |
| Mean | 6.7% | 14.2% |
| Median | 5.6% | 12.2% |
| Interquartile 25% (IQ1) | 4.4% | 8.7% |
| Interquartile 75% (IQ3) | 6.9% | 16.4% |
| Interquartile Range (IQR) | 2.5% | 7.7% |
| Standard Deviation (Sample) | 6.0% | 9.0% |
| Standard Deviation (Population) | 5.9% | 9.0% |
Similar Demographics by Family Poverty
Demographics Similar to Bulgarians by Family Poverty
In terms of family poverty, the demographic groups most similar to Bulgarians are Immigrants from Singapore (7.1%, a difference of 0.010%), Latvian (7.1%, a difference of 0.25%), Maltese (7.1%, a difference of 0.30%), Swedish (7.1%, a difference of 0.35%), and Iranian (7.1%, a difference of 0.36%).
| Demographics | Rating | Rank | Family Poverty |
| Immigrants | Taiwan | 100.0 /100 | #3 | Exceptional 6.6% |
| Filipinos | 100.0 /100 | #4 | Exceptional 6.6% |
| Thais | 100.0 /100 | #5 | Exceptional 6.7% |
| Norwegians | 99.9 /100 | #6 | Exceptional 6.9% |
| Immigrants | Ireland | 99.9 /100 | #7 | Exceptional 7.0% |
| Bhutanese | 99.9 /100 | #8 | Exceptional 7.0% |
| Latvians | 99.9 /100 | #9 | Exceptional 7.1% |
| Bulgarians | 99.8 /100 | #10 | Exceptional 7.1% |
| Immigrants | Singapore | 99.8 /100 | #11 | Exceptional 7.1% |
| Maltese | 99.8 /100 | #12 | Exceptional 7.1% |
| Swedes | 99.8 /100 | #13 | Exceptional 7.1% |
| Iranians | 99.8 /100 | #14 | Exceptional 7.1% |
| Lithuanians | 99.8 /100 | #15 | Exceptional 7.2% |
| Immigrants | South Central Asia | 99.8 /100 | #16 | Exceptional 7.2% |
| Luxembourgers | 99.8 /100 | #17 | Exceptional 7.2% |
Demographics Similar to Spaniards by Family Poverty
In terms of family poverty, the demographic groups most similar to Spaniards are Immigrants from Costa Rica (9.4%, a difference of 0.19%), Iraqi (9.3%, a difference of 0.25%), Immigrants from Colombia (9.3%, a difference of 0.28%), Immigrants from Portugal (9.4%, a difference of 0.42%), and Immigrants from Venezuela (9.3%, a difference of 0.57%).
| Demographics | Rating | Rank | Family Poverty |
| Spanish | 28.7 /100 | #192 | Fair 9.3% |
| Immigrants | Western Asia | 28.2 /100 | #193 | Fair 9.3% |
| South Americans | 28.1 /100 | #194 | Fair 9.3% |
| Venezuelans | 27.4 /100 | #195 | Fair 9.3% |
| Immigrants | Venezuela | 26.1 /100 | #196 | Fair 9.3% |
| Immigrants | Colombia | 24.4 /100 | #197 | Fair 9.3% |
| Iraqis | 24.2 /100 | #198 | Fair 9.3% |
| Spaniards | 22.8 /100 | #199 | Fair 9.4% |
| Immigrants | Costa Rica | 21.7 /100 | #200 | Fair 9.4% |
| Immigrants | Portugal | 20.5 /100 | #201 | Fair 9.4% |
| Immigrants | Sierra Leone | 19.6 /100 | #202 | Poor 9.4% |
| German Russians | 19.4 /100 | #203 | Poor 9.4% |
| Immigrants | Lebanon | 18.9 /100 | #204 | Poor 9.4% |
| Aleuts | 18.0 /100 | #205 | Poor 9.5% |
| Immigrants | South America | 18.0 /100 | #206 | Poor 9.5% |