Bulgarian vs Central American Family Poverty
COMPARE
Bulgarian
Central American
Family Poverty
Family Poverty Comparison
Bulgarians
Central Americans
7.1%
FAMILY POVERTY
99.8/ 100
METRIC RATING
10th/ 347
METRIC RANK
11.2%
FAMILY POVERTY
0.1/ 100
METRIC RATING
275th/ 347
METRIC RANK
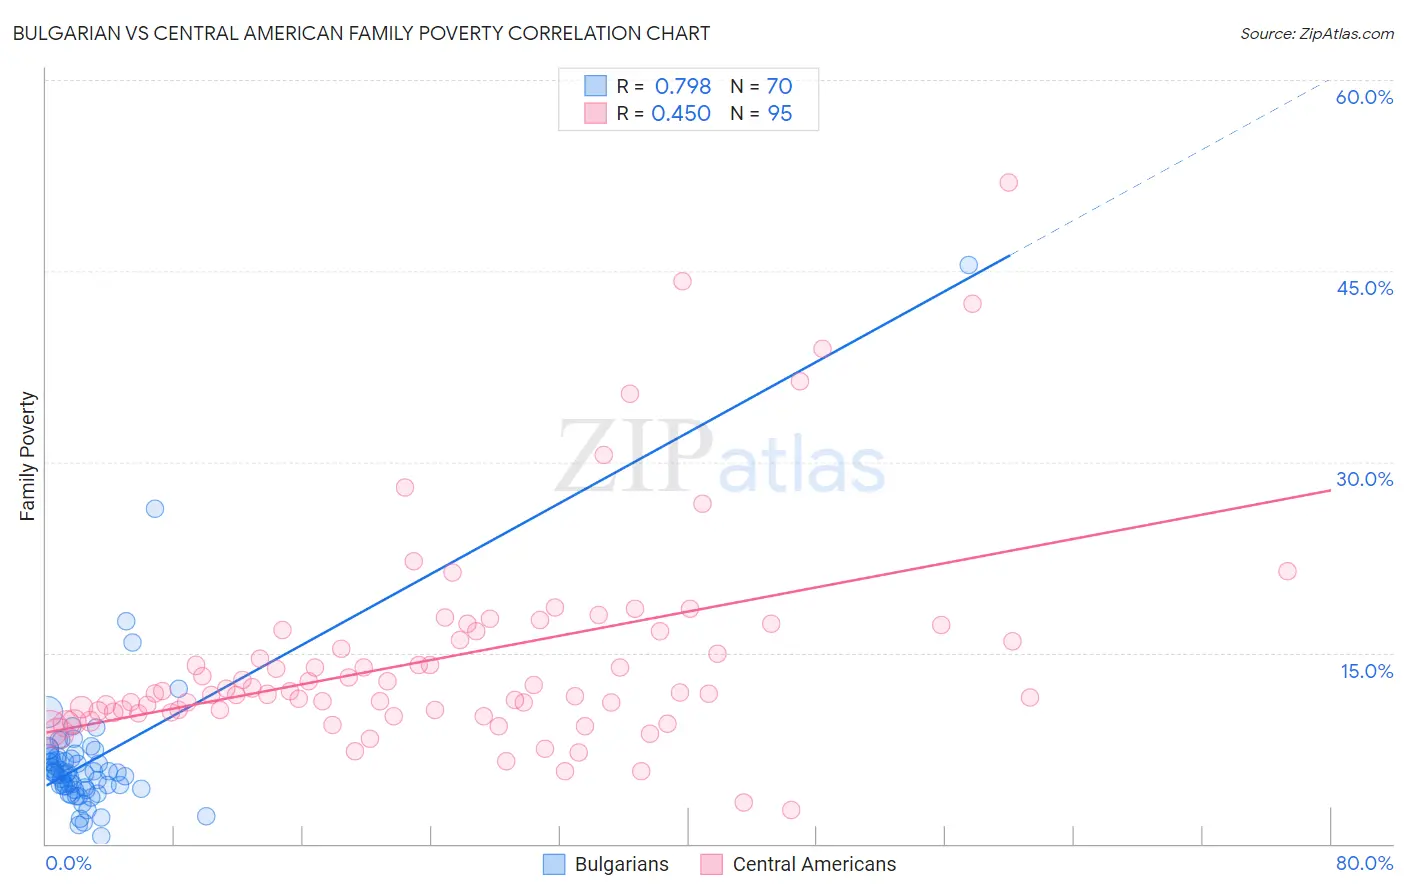
Bulgarian vs Central American Family Poverty Correlation Chart
The statistical analysis conducted on geographies consisting of 205,316,077 people shows a strong positive correlation between the proportion of Bulgarians and poverty level among families in the United States with a correlation coefficient (R) of 0.798 and weighted average of 7.1%. Similarly, the statistical analysis conducted on geographies consisting of 502,607,285 people shows a moderate positive correlation between the proportion of Central Americans and poverty level among families in the United States with a correlation coefficient (R) of 0.450 and weighted average of 11.2%, a difference of 58.2%.
Family Poverty Correlation Summary
| Measurement | Bulgarian | Central American |
| Minimum | 0.55% | 2.6% |
| Maximum | 45.5% | 51.9% |
| Range | 44.9% | 49.3% |
| Mean | 6.7% | 14.7% |
| Median | 5.6% | 11.8% |
| Interquartile 25% (IQ1) | 4.4% | 10.3% |
| Interquartile 75% (IQ3) | 6.9% | 16.7% |
| Interquartile Range (IQR) | 2.5% | 6.4% |
| Standard Deviation (Sample) | 6.0% | 8.5% |
| Standard Deviation (Population) | 5.9% | 8.5% |
Similar Demographics by Family Poverty
Demographics Similar to Bulgarians by Family Poverty
In terms of family poverty, the demographic groups most similar to Bulgarians are Immigrants from Singapore (7.1%, a difference of 0.010%), Latvian (7.1%, a difference of 0.25%), Maltese (7.1%, a difference of 0.30%), Swedish (7.1%, a difference of 0.35%), and Iranian (7.1%, a difference of 0.36%).
| Demographics | Rating | Rank | Family Poverty |
| Immigrants | Taiwan | 100.0 /100 | #3 | Exceptional 6.6% |
| Filipinos | 100.0 /100 | #4 | Exceptional 6.6% |
| Thais | 100.0 /100 | #5 | Exceptional 6.7% |
| Norwegians | 99.9 /100 | #6 | Exceptional 6.9% |
| Immigrants | Ireland | 99.9 /100 | #7 | Exceptional 7.0% |
| Bhutanese | 99.9 /100 | #8 | Exceptional 7.0% |
| Latvians | 99.9 /100 | #9 | Exceptional 7.1% |
| Bulgarians | 99.8 /100 | #10 | Exceptional 7.1% |
| Immigrants | Singapore | 99.8 /100 | #11 | Exceptional 7.1% |
| Maltese | 99.8 /100 | #12 | Exceptional 7.1% |
| Swedes | 99.8 /100 | #13 | Exceptional 7.1% |
| Iranians | 99.8 /100 | #14 | Exceptional 7.1% |
| Lithuanians | 99.8 /100 | #15 | Exceptional 7.2% |
| Immigrants | South Central Asia | 99.8 /100 | #16 | Exceptional 7.2% |
| Luxembourgers | 99.8 /100 | #17 | Exceptional 7.2% |
Demographics Similar to Central Americans by Family Poverty
In terms of family poverty, the demographic groups most similar to Central Americans are Immigrants from Guyana (11.2%, a difference of 0.020%), Spanish American (11.2%, a difference of 0.050%), Chippewa (11.2%, a difference of 0.11%), Somali (11.2%, a difference of 0.13%), and Guyanese (11.2%, a difference of 0.14%).
| Demographics | Rating | Rank | Family Poverty |
| Jamaicans | 0.1 /100 | #268 | Tragic 11.1% |
| Immigrants | Ecuador | 0.1 /100 | #269 | Tragic 11.1% |
| Immigrants | Nicaragua | 0.1 /100 | #270 | Tragic 11.1% |
| Immigrants | Bahamas | 0.1 /100 | #271 | Tragic 11.1% |
| Immigrants | Jamaica | 0.1 /100 | #272 | Tragic 11.2% |
| Somalis | 0.1 /100 | #273 | Tragic 11.2% |
| Spanish Americans | 0.1 /100 | #274 | Tragic 11.2% |
| Central Americans | 0.1 /100 | #275 | Tragic 11.2% |
| Immigrants | Guyana | 0.1 /100 | #276 | Tragic 11.2% |
| Chippewa | 0.1 /100 | #277 | Tragic 11.2% |
| Guyanese | 0.1 /100 | #278 | Tragic 11.2% |
| Blackfeet | 0.0 /100 | #279 | Tragic 11.3% |
| Belizeans | 0.0 /100 | #280 | Tragic 11.3% |
| Immigrants | West Indies | 0.0 /100 | #281 | Tragic 11.3% |
| Immigrants | Cuba | 0.0 /100 | #282 | Tragic 11.3% |