British West Indian vs Peruvian Receiving Food Stamps
COMPARE
British West Indian
Peruvian
Receiving Food Stamps
Receiving Food Stamps Comparison
British West Indians
Peruvians
17.9%
RECEIVING FOOD STAMPS
0.0/ 100
METRIC RATING
324th/ 347
METRIC RANK
11.7%
RECEIVING FOOD STAMPS
49.3/ 100
METRIC RATING
176th/ 347
METRIC RANK
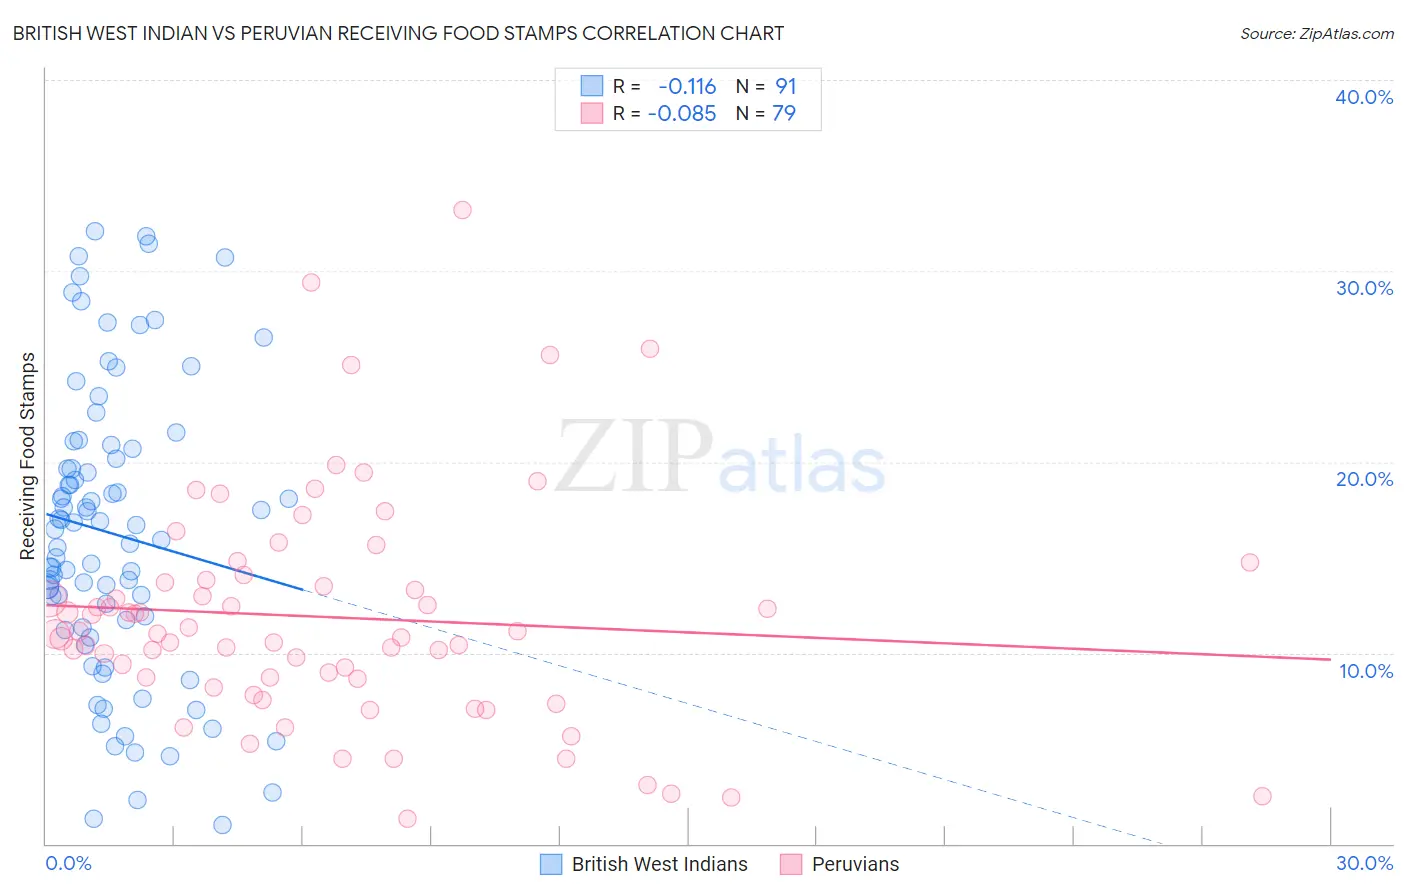
British West Indian vs Peruvian Receiving Food Stamps Correlation Chart
The statistical analysis conducted on geographies consisting of 152,421,558 people shows a poor negative correlation between the proportion of British West Indians and percentage of population receiving government assistance and/or food stamps in the United States with a correlation coefficient (R) of -0.116 and weighted average of 17.9%. Similarly, the statistical analysis conducted on geographies consisting of 362,284,397 people shows a slight negative correlation between the proportion of Peruvians and percentage of population receiving government assistance and/or food stamps in the United States with a correlation coefficient (R) of -0.085 and weighted average of 11.7%, a difference of 52.2%.
Receiving Food Stamps Correlation Summary
| Measurement | British West Indian | Peruvian |
| Minimum | 1.0% | 1.3% |
| Maximum | 32.1% | 33.2% |
| Range | 31.1% | 31.9% |
| Mean | 16.2% | 11.9% |
| Median | 16.5% | 11.0% |
| Interquartile 25% (IQ1) | 11.3% | 8.7% |
| Interquartile 75% (IQ3) | 20.7% | 13.8% |
| Interquartile Range (IQR) | 9.4% | 5.1% |
| Standard Deviation (Sample) | 7.6% | 6.0% |
| Standard Deviation (Population) | 7.5% | 5.9% |
Similar Demographics by Receiving Food Stamps
Demographics Similar to British West Indians by Receiving Food Stamps
In terms of receiving food stamps, the demographic groups most similar to British West Indians are Immigrants from Grenada (17.8%, a difference of 0.59%), Haitian (17.8%, a difference of 0.59%), Immigrants from Haiti (18.2%, a difference of 1.8%), Cuban (18.2%, a difference of 1.9%), and Apache (18.3%, a difference of 2.2%).
| Demographics | Rating | Rank | Receiving Food Stamps |
| Blacks/African Americans | 0.0 /100 | #317 | Tragic 17.2% |
| Menominee | 0.0 /100 | #318 | Tragic 17.2% |
| Immigrants | St. Vincent and the Grenadines | 0.0 /100 | #319 | Tragic 17.2% |
| Immigrants | Nicaragua | 0.0 /100 | #320 | Tragic 17.2% |
| Natives/Alaskans | 0.0 /100 | #321 | Tragic 17.3% |
| Immigrants | Grenada | 0.0 /100 | #322 | Tragic 17.8% |
| Haitians | 0.0 /100 | #323 | Tragic 17.8% |
| British West Indians | 0.0 /100 | #324 | Tragic 17.9% |
| Immigrants | Haiti | 0.0 /100 | #325 | Tragic 18.2% |
| Cubans | 0.0 /100 | #326 | Tragic 18.2% |
| Apache | 0.0 /100 | #327 | Tragic 18.3% |
| Colville | 0.0 /100 | #328 | Tragic 18.3% |
| Immigrants | Dominica | 0.0 /100 | #329 | Tragic 18.4% |
| Pima | 0.0 /100 | #330 | Tragic 19.0% |
| Immigrants | Caribbean | 0.0 /100 | #331 | Tragic 19.6% |
Demographics Similar to Peruvians by Receiving Food Stamps
In terms of receiving food stamps, the demographic groups most similar to Peruvians are Osage (11.7%, a difference of 0.070%), Immigrants from Eritrea (11.7%, a difference of 0.10%), Immigrants from Ukraine (11.8%, a difference of 0.13%), German Russian (11.8%, a difference of 0.17%), and Immigrants from Kenya (11.8%, a difference of 0.41%).
| Demographics | Rating | Rank | Receiving Food Stamps |
| Immigrants | Eastern Africa | 58.3 /100 | #169 | Average 11.6% |
| Costa Ricans | 57.9 /100 | #170 | Average 11.6% |
| Immigrants | Western Asia | 56.4 /100 | #171 | Average 11.6% |
| Guamanians/Chamorros | 54.2 /100 | #172 | Average 11.7% |
| Immigrants | Syria | 53.4 /100 | #173 | Average 11.7% |
| Immigrants | Eritrea | 50.0 /100 | #174 | Average 11.7% |
| Osage | 49.8 /100 | #175 | Average 11.7% |
| Peruvians | 49.3 /100 | #176 | Average 11.7% |
| Immigrants | Ukraine | 48.4 /100 | #177 | Average 11.8% |
| German Russians | 48.1 /100 | #178 | Average 11.8% |
| Immigrants | Kenya | 46.4 /100 | #179 | Average 11.8% |
| Uruguayans | 44.8 /100 | #180 | Average 11.8% |
| South American Indians | 41.7 /100 | #181 | Average 11.9% |
| Immigrants | Morocco | 40.7 /100 | #182 | Average 11.9% |
| Immigrants | Uganda | 40.3 /100 | #183 | Average 11.9% |