British West Indian vs Syrian Receiving Food Stamps
COMPARE
British West Indian
Syrian
Receiving Food Stamps
Receiving Food Stamps Comparison
British West Indians
Syrians
17.9%
RECEIVING FOOD STAMPS
0.0/ 100
METRIC RATING
324th/ 347
METRIC RANK
11.0%
RECEIVING FOOD STAMPS
85.5/ 100
METRIC RATING
144th/ 347
METRIC RANK
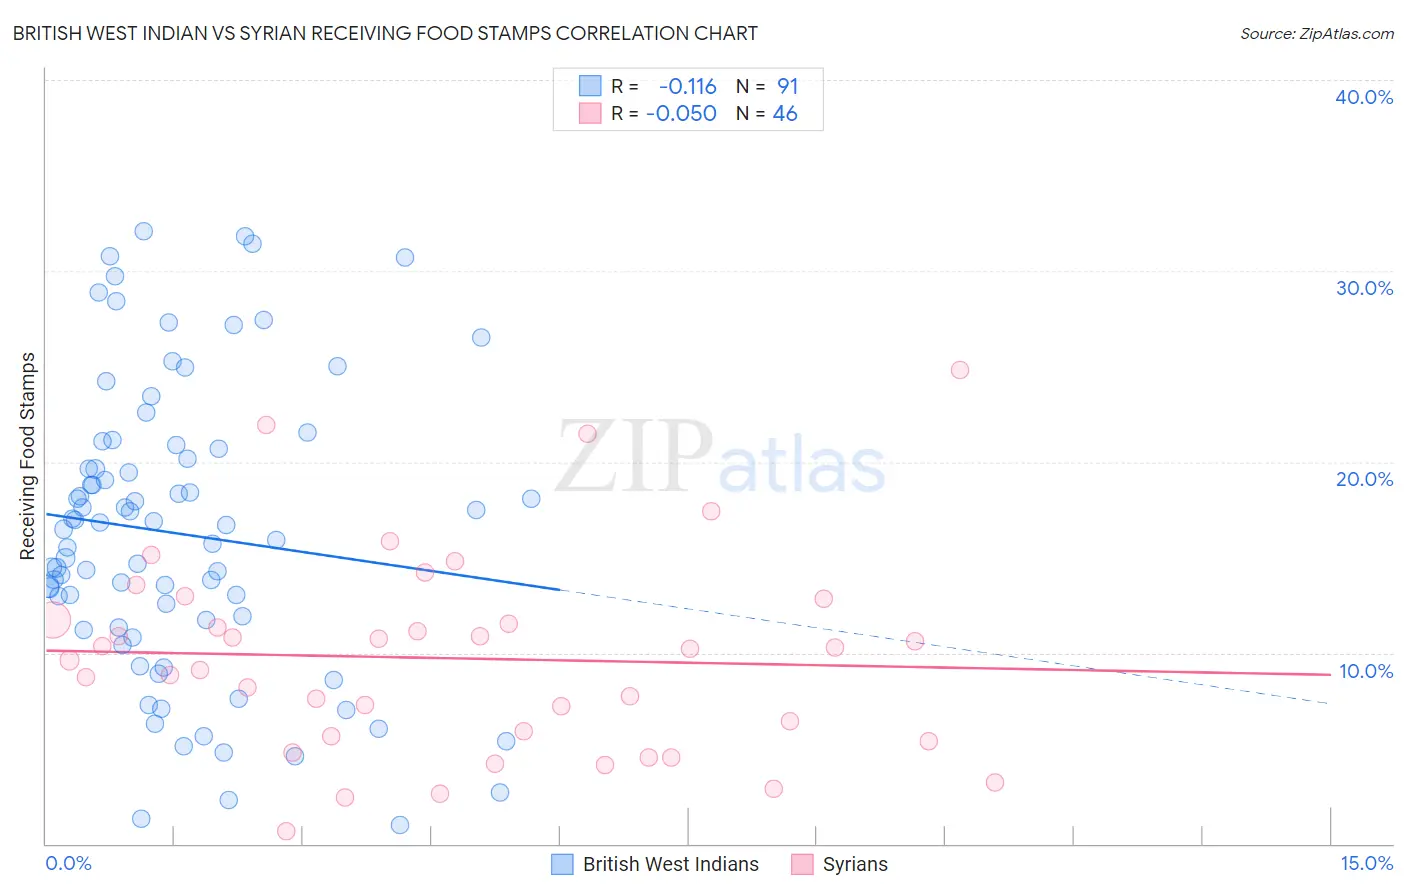
British West Indian vs Syrian Receiving Food Stamps Correlation Chart
The statistical analysis conducted on geographies consisting of 152,421,558 people shows a poor negative correlation between the proportion of British West Indians and percentage of population receiving government assistance and/or food stamps in the United States with a correlation coefficient (R) of -0.116 and weighted average of 17.9%. Similarly, the statistical analysis conducted on geographies consisting of 265,711,936 people shows a slight negative correlation between the proportion of Syrians and percentage of population receiving government assistance and/or food stamps in the United States with a correlation coefficient (R) of -0.050 and weighted average of 11.0%, a difference of 62.5%.
Receiving Food Stamps Correlation Summary
| Measurement | British West Indian | Syrian |
| Minimum | 1.0% | 0.68% |
| Maximum | 32.1% | 24.8% |
| Range | 31.1% | 24.1% |
| Mean | 16.2% | 9.7% |
| Median | 16.5% | 9.9% |
| Interquartile 25% (IQ1) | 11.3% | 5.6% |
| Interquartile 75% (IQ3) | 20.7% | 11.7% |
| Interquartile Range (IQR) | 9.4% | 6.1% |
| Standard Deviation (Sample) | 7.6% | 5.3% |
| Standard Deviation (Population) | 7.5% | 5.2% |
Similar Demographics by Receiving Food Stamps
Demographics Similar to British West Indians by Receiving Food Stamps
In terms of receiving food stamps, the demographic groups most similar to British West Indians are Immigrants from Grenada (17.8%, a difference of 0.59%), Haitian (17.8%, a difference of 0.59%), Immigrants from Haiti (18.2%, a difference of 1.8%), Cuban (18.2%, a difference of 1.9%), and Apache (18.3%, a difference of 2.2%).
| Demographics | Rating | Rank | Receiving Food Stamps |
| Blacks/African Americans | 0.0 /100 | #317 | Tragic 17.2% |
| Menominee | 0.0 /100 | #318 | Tragic 17.2% |
| Immigrants | St. Vincent and the Grenadines | 0.0 /100 | #319 | Tragic 17.2% |
| Immigrants | Nicaragua | 0.0 /100 | #320 | Tragic 17.2% |
| Natives/Alaskans | 0.0 /100 | #321 | Tragic 17.3% |
| Immigrants | Grenada | 0.0 /100 | #322 | Tragic 17.8% |
| Haitians | 0.0 /100 | #323 | Tragic 17.8% |
| British West Indians | 0.0 /100 | #324 | Tragic 17.9% |
| Immigrants | Haiti | 0.0 /100 | #325 | Tragic 18.2% |
| Cubans | 0.0 /100 | #326 | Tragic 18.2% |
| Apache | 0.0 /100 | #327 | Tragic 18.3% |
| Colville | 0.0 /100 | #328 | Tragic 18.3% |
| Immigrants | Dominica | 0.0 /100 | #329 | Tragic 18.4% |
| Pima | 0.0 /100 | #330 | Tragic 19.0% |
| Immigrants | Caribbean | 0.0 /100 | #331 | Tragic 19.6% |
Demographics Similar to Syrians by Receiving Food Stamps
In terms of receiving food stamps, the demographic groups most similar to Syrians are Hungarian (11.0%, a difference of 0.12%), Immigrants from Northern Africa (11.0%, a difference of 0.15%), Chilean (11.0%, a difference of 0.23%), Taiwanese (11.0%, a difference of 0.36%), and Immigrants from Vietnam (11.0%, a difference of 0.40%).
| Demographics | Rating | Rank | Receiving Food Stamps |
| Immigrants | Eastern Europe | 89.8 /100 | #137 | Excellent 10.8% |
| Immigrants | Moldova | 88.5 /100 | #138 | Excellent 10.9% |
| Hmong | 88.4 /100 | #139 | Excellent 10.9% |
| Celtics | 87.8 /100 | #140 | Excellent 10.9% |
| Immigrants | Vietnam | 86.7 /100 | #141 | Excellent 11.0% |
| Chileans | 86.2 /100 | #142 | Excellent 11.0% |
| Immigrants | Northern Africa | 86.0 /100 | #143 | Excellent 11.0% |
| Syrians | 85.5 /100 | #144 | Excellent 11.0% |
| Hungarians | 85.1 /100 | #145 | Excellent 11.0% |
| Taiwanese | 84.2 /100 | #146 | Excellent 11.0% |
| Whites/Caucasians | 83.9 /100 | #147 | Excellent 11.1% |
| Immigrants | South Eastern Asia | 83.3 /100 | #148 | Excellent 11.1% |
| Brazilians | 83.2 /100 | #149 | Excellent 11.1% |
| Soviet Union | 83.1 /100 | #150 | Excellent 11.1% |
| Immigrants | Spain | 81.7 /100 | #151 | Excellent 11.1% |