British West Indian vs Peruvian 9th Grade
COMPARE
British West Indian
Peruvian
9th Grade
9th Grade Comparison
British West Indians
Peruvians
93.2%
9TH GRADE
0.0/ 100
METRIC RATING
291st/ 347
METRIC RANK
93.8%
9TH GRADE
0.2/ 100
METRIC RATING
274th/ 347
METRIC RANK
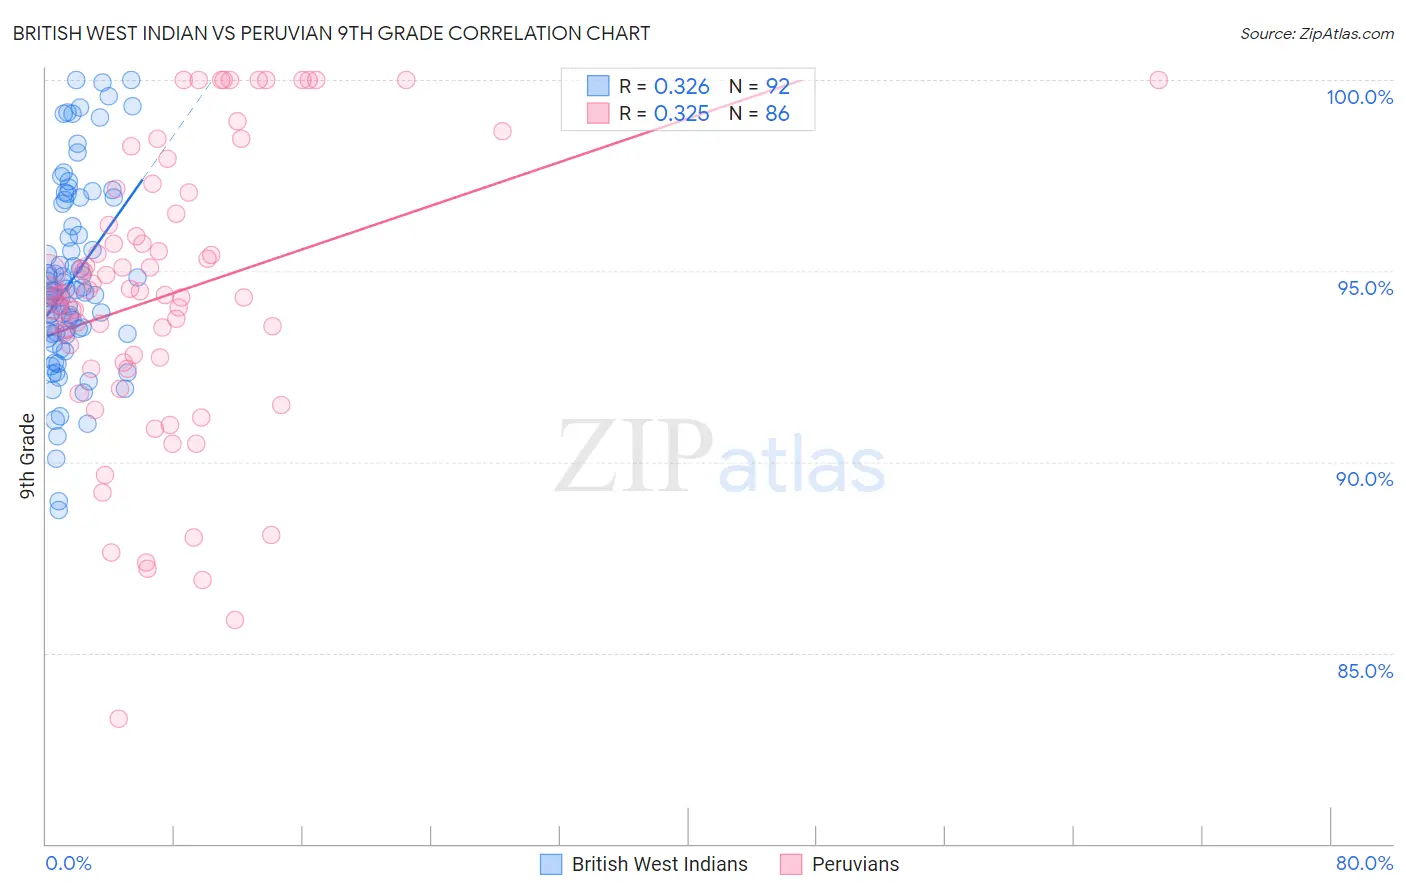
British West Indian vs Peruvian 9th Grade Correlation Chart
The statistical analysis conducted on geographies consisting of 152,691,173 people shows a mild positive correlation between the proportion of British West Indians and percentage of population with at least 9th grade education in the United States with a correlation coefficient (R) of 0.326 and weighted average of 93.2%. Similarly, the statistical analysis conducted on geographies consisting of 363,251,075 people shows a mild positive correlation between the proportion of Peruvians and percentage of population with at least 9th grade education in the United States with a correlation coefficient (R) of 0.325 and weighted average of 93.8%, a difference of 0.62%.
9th Grade Correlation Summary
| Measurement | British West Indian | Peruvian |
| Minimum | 88.8% | 83.3% |
| Maximum | 100.0% | 100.0% |
| Range | 11.2% | 16.7% |
| Mean | 94.8% | 94.4% |
| Median | 94.4% | 94.4% |
| Interquartile 25% (IQ1) | 93.3% | 92.6% |
| Interquartile 75% (IQ3) | 96.8% | 96.5% |
| Interquartile Range (IQR) | 3.5% | 3.9% |
| Standard Deviation (Sample) | 2.5% | 3.7% |
| Standard Deviation (Population) | 2.5% | 3.7% |
Demographics Similar to British West Indians and Peruvians by 9th Grade
In terms of 9th grade, the demographic groups most similar to British West Indians are Immigrants from Laos (93.2%, a difference of 0.020%), Pennsylvania German (93.3%, a difference of 0.080%), Immigrants from West Indies (93.3%, a difference of 0.090%), Immigrants from South Eastern Asia (93.3%, a difference of 0.15%), and Immigrants from St. Vincent and the Grenadines (93.4%, a difference of 0.18%). Similarly, the demographic groups most similar to Peruvians are Immigrants from South America (93.8%, a difference of 0.0%), Immigrants from Western Africa (93.8%, a difference of 0.010%), Immigrants from Colombia (93.8%, a difference of 0.010%), West Indian (93.7%, a difference of 0.030%), and Immigrants from Philippines (93.7%, a difference of 0.030%).
| Demographics | Rating | Rank | 9th Grade |
| Immigrants | Western Africa | 0.2 /100 | #272 | Tragic 93.8% |
| Immigrants | South America | 0.2 /100 | #273 | Tragic 93.8% |
| Peruvians | 0.2 /100 | #274 | Tragic 93.8% |
| Immigrants | Colombia | 0.2 /100 | #275 | Tragic 93.8% |
| West Indians | 0.2 /100 | #276 | Tragic 93.7% |
| Immigrants | Philippines | 0.1 /100 | #277 | Tragic 93.7% |
| Immigrants | Eritrea | 0.1 /100 | #278 | Tragic 93.7% |
| Trinidadians and Tobagonians | 0.1 /100 | #279 | Tragic 93.7% |
| Taiwanese | 0.1 /100 | #280 | Tragic 93.6% |
| Immigrants | Trinidad and Tobago | 0.1 /100 | #281 | Tragic 93.6% |
| Malaysians | 0.0 /100 | #282 | Tragic 93.5% |
| Barbadians | 0.0 /100 | #283 | Tragic 93.5% |
| Bangladeshis | 0.0 /100 | #284 | Tragic 93.4% |
| Immigrants | Peru | 0.0 /100 | #285 | Tragic 93.4% |
| Immigrants | Barbados | 0.0 /100 | #286 | Tragic 93.4% |
| Immigrants | St. Vincent and the Grenadines | 0.0 /100 | #287 | Tragic 93.4% |
| Immigrants | South Eastern Asia | 0.0 /100 | #288 | Tragic 93.3% |
| Immigrants | West Indies | 0.0 /100 | #289 | Tragic 93.3% |
| Pennsylvania Germans | 0.0 /100 | #290 | Tragic 93.3% |
| British West Indians | 0.0 /100 | #291 | Tragic 93.2% |
| Immigrants | Laos | 0.0 /100 | #292 | Tragic 93.2% |