British West Indian vs Maltese Single Mother Households
COMPARE
British West Indian
Maltese
Single Mother Households
Single Mother Households Comparison
British West Indians
Maltese
8.4%
SINGLE MOTHER HOUSEHOLDS
0.0/ 100
METRIC RATING
326th/ 347
METRIC RANK
5.2%
SINGLE MOTHER HOUSEHOLDS
99.9/ 100
METRIC RATING
20th/ 347
METRIC RANK
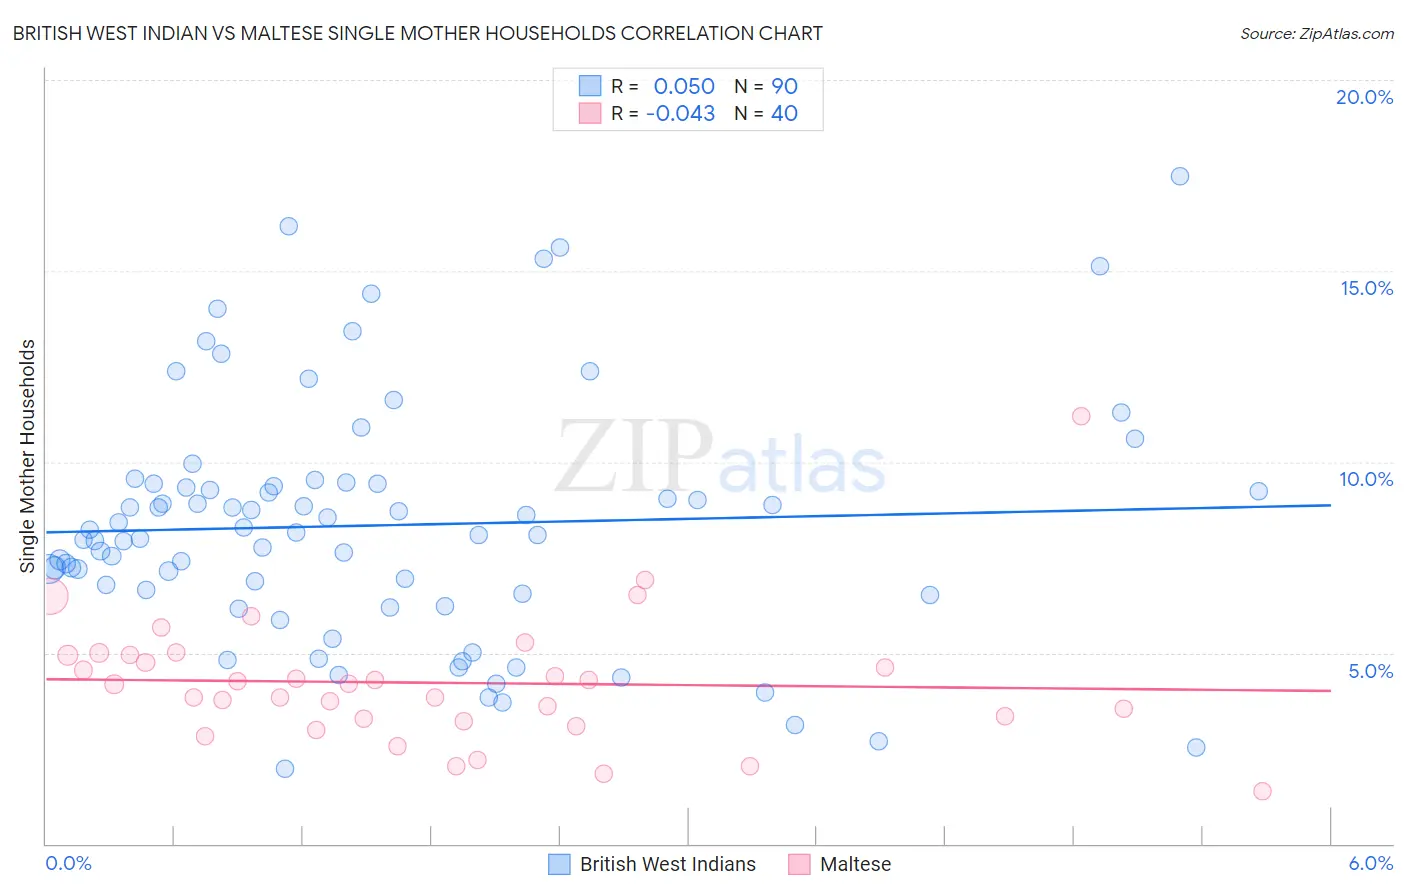
British West Indian vs Maltese Single Mother Households Correlation Chart
The statistical analysis conducted on geographies consisting of 152,574,422 people shows no correlation between the proportion of British West Indians and percentage of single mother households in the United States with a correlation coefficient (R) of 0.050 and weighted average of 8.4%. Similarly, the statistical analysis conducted on geographies consisting of 126,155,970 people shows no correlation between the proportion of Maltese and percentage of single mother households in the United States with a correlation coefficient (R) of -0.043 and weighted average of 5.2%, a difference of 61.7%.
Single Mother Households Correlation Summary
| Measurement | British West Indian | Maltese |
| Minimum | 2.0% | 1.4% |
| Maximum | 17.5% | 11.2% |
| Range | 15.5% | 9.8% |
| Mean | 8.3% | 4.2% |
| Median | 8.1% | 4.2% |
| Interquartile 25% (IQ1) | 6.5% | 3.3% |
| Interquartile 75% (IQ3) | 9.4% | 4.9% |
| Interquartile Range (IQR) | 2.9% | 1.7% |
| Standard Deviation (Sample) | 3.2% | 1.7% |
| Standard Deviation (Population) | 3.2% | 1.7% |
Similar Demographics by Single Mother Households
Demographics Similar to British West Indians by Single Mother Households
In terms of single mother households, the demographic groups most similar to British West Indians are Immigrants from Caribbean (8.4%, a difference of 0.12%), Immigrants from Haiti (8.4%, a difference of 0.15%), Immigrants from Jamaica (8.4%, a difference of 0.31%), Yakama (8.4%, a difference of 0.32%), and Haitian (8.3%, a difference of 0.74%).
| Demographics | Rating | Rank | Single Mother Households |
| Jamaicans | 0.0 /100 | #319 | Tragic 8.2% |
| Bahamians | 0.0 /100 | #320 | Tragic 8.3% |
| Immigrants | Senegal | 0.0 /100 | #321 | Tragic 8.3% |
| Pima | 0.0 /100 | #322 | Tragic 8.3% |
| Haitians | 0.0 /100 | #323 | Tragic 8.3% |
| Immigrants | Jamaica | 0.0 /100 | #324 | Tragic 8.4% |
| Immigrants | Caribbean | 0.0 /100 | #325 | Tragic 8.4% |
| British West Indians | 0.0 /100 | #326 | Tragic 8.4% |
| Immigrants | Haiti | 0.0 /100 | #327 | Tragic 8.4% |
| Yakama | 0.0 /100 | #328 | Tragic 8.4% |
| Hopi | 0.0 /100 | #329 | Tragic 8.5% |
| Inupiat | 0.0 /100 | #330 | Tragic 8.5% |
| Sioux | 0.0 /100 | #331 | Tragic 8.5% |
| U.S. Virgin Islanders | 0.0 /100 | #332 | Tragic 8.6% |
| Liberians | 0.0 /100 | #333 | Tragic 8.6% |
Demographics Similar to Maltese by Single Mother Households
In terms of single mother households, the demographic groups most similar to Maltese are Eastern European (5.2%, a difference of 0.060%), Chinese (5.2%, a difference of 0.47%), Immigrants from Armenia (5.2%, a difference of 0.57%), Thai (5.2%, a difference of 0.78%), and Immigrants from Austria (5.2%, a difference of 0.83%).
| Demographics | Rating | Rank | Single Mother Households |
| Immigrants | India | 99.9 /100 | #13 | Exceptional 5.1% |
| Immigrants | Australia | 99.9 /100 | #14 | Exceptional 5.1% |
| Immigrants | Eastern Asia | 99.9 /100 | #15 | Exceptional 5.1% |
| Indians (Asian) | 99.9 /100 | #16 | Exceptional 5.1% |
| Soviet Union | 99.9 /100 | #17 | Exceptional 5.1% |
| Immigrants | Armenia | 99.9 /100 | #18 | Exceptional 5.2% |
| Chinese | 99.9 /100 | #19 | Exceptional 5.2% |
| Maltese | 99.9 /100 | #20 | Exceptional 5.2% |
| Eastern Europeans | 99.8 /100 | #21 | Exceptional 5.2% |
| Thais | 99.8 /100 | #22 | Exceptional 5.2% |
| Immigrants | Austria | 99.8 /100 | #23 | Exceptional 5.2% |
| Armenians | 99.8 /100 | #24 | Exceptional 5.2% |
| Immigrants | Japan | 99.8 /100 | #25 | Exceptional 5.2% |
| Immigrants | Lithuania | 99.8 /100 | #26 | Exceptional 5.3% |
| Bhutanese | 99.7 /100 | #27 | Exceptional 5.3% |