Immigrants from Grenada vs Immigrants from Europe Child Poverty Under the Age of 5
COMPARE
Immigrants from Grenada
Immigrants from Europe
Child Poverty Under the Age of 5
Child Poverty Under the Age of 5 Comparison
Immigrants from Grenada
Immigrants from Europe
20.7%
CHILD POVERTY UNDER THE AGE OF 5
0.0/ 100
METRIC RATING
278th/ 347
METRIC RANK
15.1%
CHILD POVERTY UNDER THE AGE OF 5
99.1/ 100
METRIC RATING
63rd/ 347
METRIC RANK
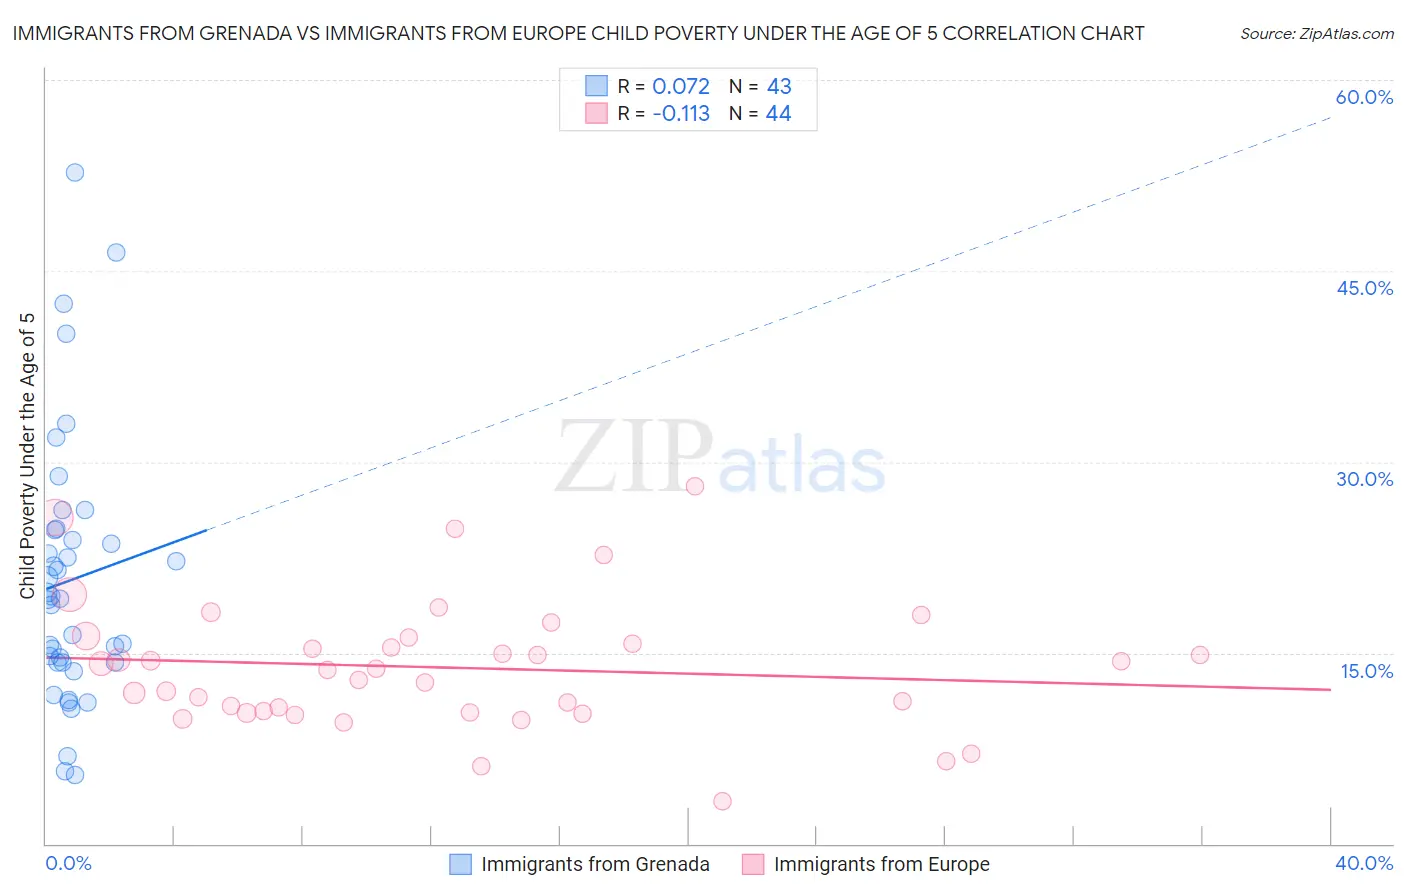
Immigrants from Grenada vs Immigrants from Europe Child Poverty Under the Age of 5 Correlation Chart
The statistical analysis conducted on geographies consisting of 66,612,136 people shows a slight positive correlation between the proportion of Immigrants from Grenada and poverty level among children under the age of 5 in the United States with a correlation coefficient (R) of 0.072 and weighted average of 20.7%. Similarly, the statistical analysis conducted on geographies consisting of 511,883,823 people shows a poor negative correlation between the proportion of Immigrants from Europe and poverty level among children under the age of 5 in the United States with a correlation coefficient (R) of -0.113 and weighted average of 15.1%, a difference of 36.5%.
Child Poverty Under the Age of 5 Correlation Summary
| Measurement | Immigrants from Grenada | Immigrants from Europe |
| Minimum | 5.4% | 3.3% |
| Maximum | 52.7% | 28.1% |
| Range | 47.3% | 24.7% |
| Mean | 20.7% | 13.8% |
| Median | 19.3% | 13.7% |
| Interquartile 25% (IQ1) | 14.2% | 10.4% |
| Interquartile 75% (IQ3) | 24.7% | 16.0% |
| Interquartile Range (IQR) | 10.5% | 5.6% |
| Standard Deviation (Sample) | 10.3% | 5.1% |
| Standard Deviation (Population) | 10.2% | 5.0% |
Similar Demographics by Child Poverty Under the Age of 5
Demographics Similar to Immigrants from Grenada by Child Poverty Under the Age of 5
In terms of child poverty under the age of 5, the demographic groups most similar to Immigrants from Grenada are Immigrants from West Indies (20.7%, a difference of 0.020%), West Indian (20.6%, a difference of 0.19%), Bangladeshi (20.6%, a difference of 0.28%), Immigrants from Belize (20.6%, a difference of 0.33%), and Subsaharan African (20.8%, a difference of 0.37%).
| Demographics | Rating | Rank | Child Poverty Under the Age of 5 |
| Americans | 0.1 /100 | #271 | Tragic 20.5% |
| Immigrants | Jamaica | 0.1 /100 | #272 | Tragic 20.5% |
| Central Americans | 0.1 /100 | #273 | Tragic 20.6% |
| Immigrants | Belize | 0.1 /100 | #274 | Tragic 20.6% |
| Bangladeshis | 0.1 /100 | #275 | Tragic 20.6% |
| West Indians | 0.0 /100 | #276 | Tragic 20.6% |
| Immigrants | West Indies | 0.0 /100 | #277 | Tragic 20.7% |
| Immigrants | Grenada | 0.0 /100 | #278 | Tragic 20.7% |
| Sub-Saharan Africans | 0.0 /100 | #279 | Tragic 20.8% |
| French American Indians | 0.0 /100 | #280 | Tragic 20.8% |
| Senegalese | 0.0 /100 | #281 | Tragic 20.9% |
| Potawatomi | 0.0 /100 | #282 | Tragic 21.0% |
| Comanche | 0.0 /100 | #283 | Tragic 21.0% |
| Somalis | 0.0 /100 | #284 | Tragic 21.1% |
| Haitians | 0.0 /100 | #285 | Tragic 21.2% |
Demographics Similar to Immigrants from Europe by Child Poverty Under the Age of 5
In terms of child poverty under the age of 5, the demographic groups most similar to Immigrants from Europe are Immigrants from Romania (15.2%, a difference of 0.020%), Immigrants from Fiji (15.2%, a difference of 0.050%), Immigrants from Eastern Europe (15.1%, a difference of 0.13%), Immigrants from Scotland (15.2%, a difference of 0.16%), and Greek (15.2%, a difference of 0.23%).
| Demographics | Rating | Rank | Child Poverty Under the Age of 5 |
| Immigrants | Pakistan | 99.4 /100 | #56 | Exceptional 14.9% |
| Egyptians | 99.4 /100 | #57 | Exceptional 14.9% |
| Swedes | 99.4 /100 | #58 | Exceptional 15.0% |
| Paraguayans | 99.4 /100 | #59 | Exceptional 15.0% |
| Immigrants | Russia | 99.3 /100 | #60 | Exceptional 15.0% |
| Immigrants | Poland | 99.1 /100 | #61 | Exceptional 15.1% |
| Immigrants | Eastern Europe | 99.1 /100 | #62 | Exceptional 15.1% |
| Immigrants | Europe | 99.1 /100 | #63 | Exceptional 15.1% |
| Immigrants | Romania | 99.1 /100 | #64 | Exceptional 15.2% |
| Immigrants | Fiji | 99.0 /100 | #65 | Exceptional 15.2% |
| Immigrants | Scotland | 99.0 /100 | #66 | Exceptional 15.2% |
| Greeks | 99.0 /100 | #67 | Exceptional 15.2% |
| Zimbabweans | 99.0 /100 | #68 | Exceptional 15.2% |
| Lithuanians | 99.0 /100 | #69 | Exceptional 15.2% |
| Immigrants | Belgium | 98.8 /100 | #70 | Exceptional 15.3% |