Iranian vs Immigrants from Sudan Female Poverty Among 25-34 Year Olds
COMPARE
Iranian
Immigrants from Sudan
Female Poverty Among 25-34 Year Olds
Female Poverty Among 25-34 Year Olds Comparison
Iranians
Immigrants from Sudan
11.2%
FEMALE POVERTY AMONG 25-34 YEAR OLDS
100.0/ 100
METRIC RATING
19th/ 347
METRIC RANK
14.4%
FEMALE POVERTY AMONG 25-34 YEAR OLDS
4.0/ 100
METRIC RATING
224th/ 347
METRIC RANK
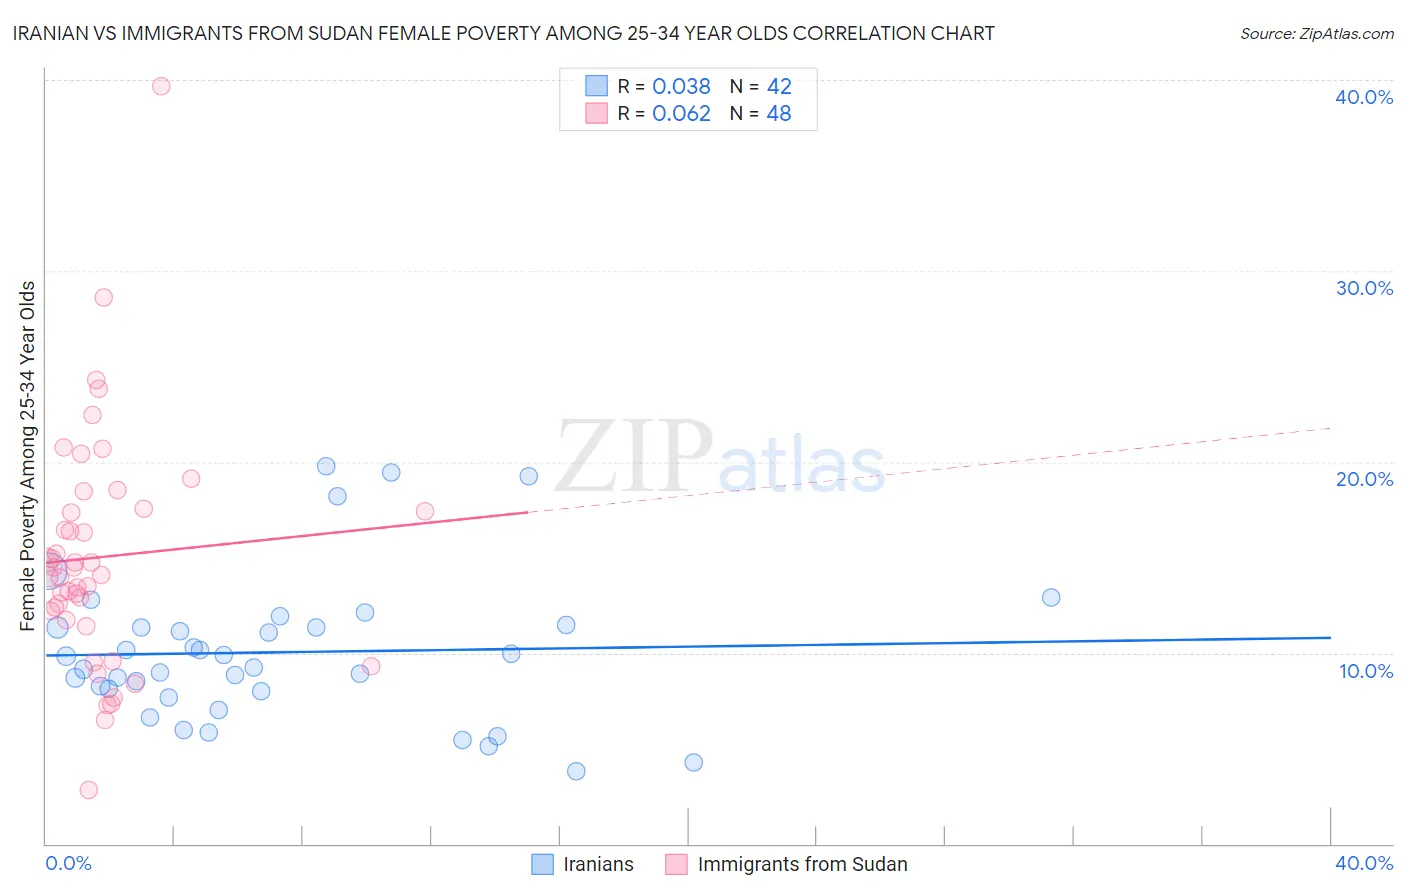
Iranian vs Immigrants from Sudan Female Poverty Among 25-34 Year Olds Correlation Chart
The statistical analysis conducted on geographies consisting of 312,428,858 people shows no correlation between the proportion of Iranians and poverty level among females between the ages 25 and 34 in the United States with a correlation coefficient (R) of 0.038 and weighted average of 11.2%. Similarly, the statistical analysis conducted on geographies consisting of 118,579,963 people shows a slight positive correlation between the proportion of Immigrants from Sudan and poverty level among females between the ages 25 and 34 in the United States with a correlation coefficient (R) of 0.062 and weighted average of 14.4%, a difference of 28.5%.
Female Poverty Among 25-34 Year Olds Correlation Summary
| Measurement | Iranian | Immigrants from Sudan |
| Minimum | 3.8% | 2.8% |
| Maximum | 19.8% | 39.6% |
| Range | 16.0% | 36.9% |
| Mean | 10.0% | 15.0% |
| Median | 9.5% | 14.3% |
| Interquartile 25% (IQ1) | 8.0% | 12.0% |
| Interquartile 75% (IQ3) | 11.3% | 17.5% |
| Interquartile Range (IQR) | 3.4% | 5.5% |
| Standard Deviation (Sample) | 3.8% | 6.2% |
| Standard Deviation (Population) | 3.8% | 6.1% |
Similar Demographics by Female Poverty Among 25-34 Year Olds
Demographics Similar to Iranians by Female Poverty Among 25-34 Year Olds
In terms of female poverty among 25-34 year olds, the demographic groups most similar to Iranians are Immigrants from Eastern Asia (11.2%, a difference of 0.14%), Immigrants from China (11.2%, a difference of 0.25%), Immigrants from Bolivia (11.2%, a difference of 0.32%), Assyrian/Chaldean/Syriac (11.2%, a difference of 0.36%), and Burmese (11.2%, a difference of 0.47%).
| Demographics | Rating | Rank | Female Poverty Among 25-34 Year Olds |
| Immigrants | Ireland | 100.0 /100 | #12 | Exceptional 11.2% |
| Burmese | 100.0 /100 | #13 | Exceptional 11.2% |
| Indians (Asian) | 100.0 /100 | #14 | Exceptional 11.2% |
| Assyrians/Chaldeans/Syriacs | 100.0 /100 | #15 | Exceptional 11.2% |
| Immigrants | Bolivia | 100.0 /100 | #16 | Exceptional 11.2% |
| Immigrants | China | 100.0 /100 | #17 | Exceptional 11.2% |
| Immigrants | Eastern Asia | 100.0 /100 | #18 | Exceptional 11.2% |
| Iranians | 100.0 /100 | #19 | Exceptional 11.2% |
| Okinawans | 100.0 /100 | #20 | Exceptional 11.3% |
| Turks | 100.0 /100 | #21 | Exceptional 11.4% |
| Asians | 99.9 /100 | #22 | Exceptional 11.4% |
| Bolivians | 99.9 /100 | #23 | Exceptional 11.4% |
| Maltese | 99.9 /100 | #24 | Exceptional 11.4% |
| Bhutanese | 99.9 /100 | #25 | Exceptional 11.4% |
| Tongans | 99.9 /100 | #26 | Exceptional 11.5% |
Demographics Similar to Immigrants from Sudan by Female Poverty Among 25-34 Year Olds
In terms of female poverty among 25-34 year olds, the demographic groups most similar to Immigrants from Sudan are Nigerian (14.4%, a difference of 0.070%), Immigrants from Portugal (14.4%, a difference of 0.13%), Sudanese (14.4%, a difference of 0.20%), Immigrants from Barbados (14.5%, a difference of 0.32%), and Ghanaian (14.4%, a difference of 0.36%).
| Demographics | Rating | Rank | Female Poverty Among 25-34 Year Olds |
| Spanish American Indians | 5.5 /100 | #217 | Tragic 14.3% |
| Immigrants | Thailand | 5.2 /100 | #218 | Tragic 14.3% |
| Ecuadorians | 5.2 /100 | #219 | Tragic 14.3% |
| Ghanaians | 4.8 /100 | #220 | Tragic 14.4% |
| Sudanese | 4.4 /100 | #221 | Tragic 14.4% |
| Immigrants | Portugal | 4.3 /100 | #222 | Tragic 14.4% |
| Nigerians | 4.2 /100 | #223 | Tragic 14.4% |
| Immigrants | Sudan | 4.0 /100 | #224 | Tragic 14.4% |
| Immigrants | Barbados | 3.4 /100 | #225 | Tragic 14.5% |
| Nicaraguans | 3.3 /100 | #226 | Tragic 14.5% |
| Celtics | 2.8 /100 | #227 | Tragic 14.5% |
| Vietnamese | 2.6 /100 | #228 | Tragic 14.6% |
| Spanish | 2.5 /100 | #229 | Tragic 14.6% |
| Spaniards | 2.3 /100 | #230 | Tragic 14.6% |
| Delaware | 2.3 /100 | #231 | Tragic 14.6% |