Thai vs Hawaiian Female Poverty Among 25-34 Year Olds
COMPARE
Thai
Hawaiian
Female Poverty Among 25-34 Year Olds
Female Poverty Among 25-34 Year Olds Comparison
Thais
Hawaiians
10.2%
FEMALE POVERTY AMONG 25-34 YEAR OLDS
100.0/ 100
METRIC RATING
4th/ 347
METRIC RANK
14.1%
FEMALE POVERTY AMONG 25-34 YEAR OLDS
13.6/ 100
METRIC RATING
204th/ 347
METRIC RANK
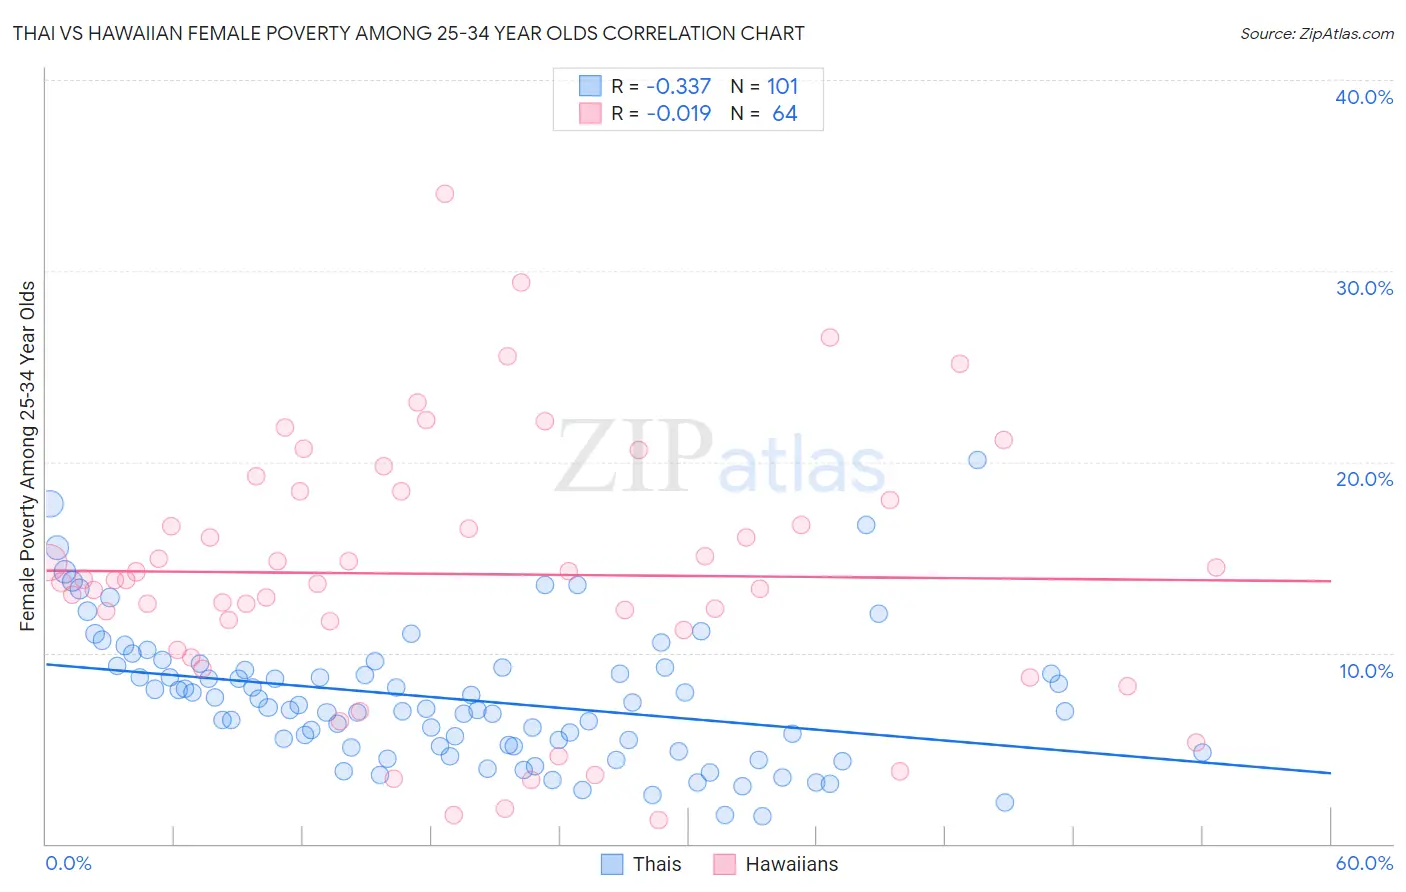
Thai vs Hawaiian Female Poverty Among 25-34 Year Olds Correlation Chart
The statistical analysis conducted on geographies consisting of 465,466,782 people shows a mild negative correlation between the proportion of Thais and poverty level among females between the ages 25 and 34 in the United States with a correlation coefficient (R) of -0.337 and weighted average of 10.2%. Similarly, the statistical analysis conducted on geographies consisting of 324,442,153 people shows no correlation between the proportion of Hawaiians and poverty level among females between the ages 25 and 34 in the United States with a correlation coefficient (R) of -0.019 and weighted average of 14.1%, a difference of 37.3%.
Female Poverty Among 25-34 Year Olds Correlation Summary
| Measurement | Thai | Hawaiian |
| Minimum | 1.4% | 1.2% |
| Maximum | 20.1% | 34.1% |
| Range | 18.6% | 32.8% |
| Mean | 7.6% | 14.1% |
| Median | 7.1% | 13.8% |
| Interquartile 25% (IQ1) | 5.1% | 10.7% |
| Interquartile 75% (IQ3) | 9.2% | 18.2% |
| Interquartile Range (IQR) | 4.1% | 7.5% |
| Standard Deviation (Sample) | 3.5% | 6.8% |
| Standard Deviation (Population) | 3.5% | 6.8% |
Similar Demographics by Female Poverty Among 25-34 Year Olds
Demographics Similar to Thais by Female Poverty Among 25-34 Year Olds
In terms of female poverty among 25-34 year olds, the demographic groups most similar to Thais are Filipino (10.2%, a difference of 0.17%), Immigrants from Hong Kong (10.4%, a difference of 1.4%), Immigrants from Taiwan (10.0%, a difference of 2.2%), Immigrants from South Central Asia (10.8%, a difference of 5.1%), and Immigrants from India (9.7%, a difference of 5.4%).
| Demographics | Rating | Rank | Female Poverty Among 25-34 Year Olds |
| Immigrants | India | 100.0 /100 | #1 | Exceptional 9.7% |
| Immigrants | Taiwan | 100.0 /100 | #2 | Exceptional 10.0% |
| Filipinos | 100.0 /100 | #3 | Exceptional 10.2% |
| Thais | 100.0 /100 | #4 | Exceptional 10.2% |
| Immigrants | Hong Kong | 100.0 /100 | #5 | Exceptional 10.4% |
| Immigrants | South Central Asia | 100.0 /100 | #6 | Exceptional 10.8% |
| Chinese | 100.0 /100 | #7 | Exceptional 11.0% |
| Immigrants | Iran | 100.0 /100 | #8 | Exceptional 11.0% |
| Immigrants | Singapore | 100.0 /100 | #9 | Exceptional 11.1% |
| Immigrants | Lithuania | 100.0 /100 | #10 | Exceptional 11.1% |
| Immigrants | Korea | 100.0 /100 | #11 | Exceptional 11.1% |
| Immigrants | Ireland | 100.0 /100 | #12 | Exceptional 11.2% |
| Burmese | 100.0 /100 | #13 | Exceptional 11.2% |
| Indians (Asian) | 100.0 /100 | #14 | Exceptional 11.2% |
| Assyrians/Chaldeans/Syriacs | 100.0 /100 | #15 | Exceptional 11.2% |
Demographics Similar to Hawaiians by Female Poverty Among 25-34 Year Olds
In terms of female poverty among 25-34 year olds, the demographic groups most similar to Hawaiians are Immigrants from Africa (14.1%, a difference of 0.050%), Immigrants (14.0%, a difference of 0.15%), Hungarian (14.1%, a difference of 0.33%), Japanese (14.1%, a difference of 0.35%), and Immigrants from Panama (14.1%, a difference of 0.37%).
| Demographics | Rating | Rank | Female Poverty Among 25-34 Year Olds |
| Immigrants | Saudi Arabia | 21.9 /100 | #197 | Fair 13.9% |
| Immigrants | Germany | 20.9 /100 | #198 | Fair 13.9% |
| English | 20.4 /100 | #199 | Fair 13.9% |
| Hmong | 20.3 /100 | #200 | Fair 13.9% |
| Immigrants | Trinidad and Tobago | 17.6 /100 | #201 | Poor 14.0% |
| Welsh | 17.2 /100 | #202 | Poor 14.0% |
| Immigrants | Immigrants | 14.5 /100 | #203 | Poor 14.0% |
| Hawaiians | 13.6 /100 | #204 | Poor 14.1% |
| Immigrants | Africa | 13.4 /100 | #205 | Poor 14.1% |
| Hungarians | 11.8 /100 | #206 | Poor 14.1% |
| Japanese | 11.7 /100 | #207 | Poor 14.1% |
| Immigrants | Panama | 11.6 /100 | #208 | Poor 14.1% |
| Guyanese | 8.6 /100 | #209 | Tragic 14.2% |
| Panamanians | 8.6 /100 | #210 | Tragic 14.2% |
| Trinidadians and Tobagonians | 8.2 /100 | #211 | Tragic 14.2% |