Brazilian vs Welsh Single Male Poverty
COMPARE
Brazilian
Welsh
Single Male Poverty
Single Male Poverty Comparison
Brazilians
Welsh
11.8%
SINGLE MALE POVERTY
99.8/ 100
METRIC RATING
59th/ 347
METRIC RANK
14.0%
SINGLE MALE POVERTY
0.1/ 100
METRIC RATING
273rd/ 347
METRIC RANK
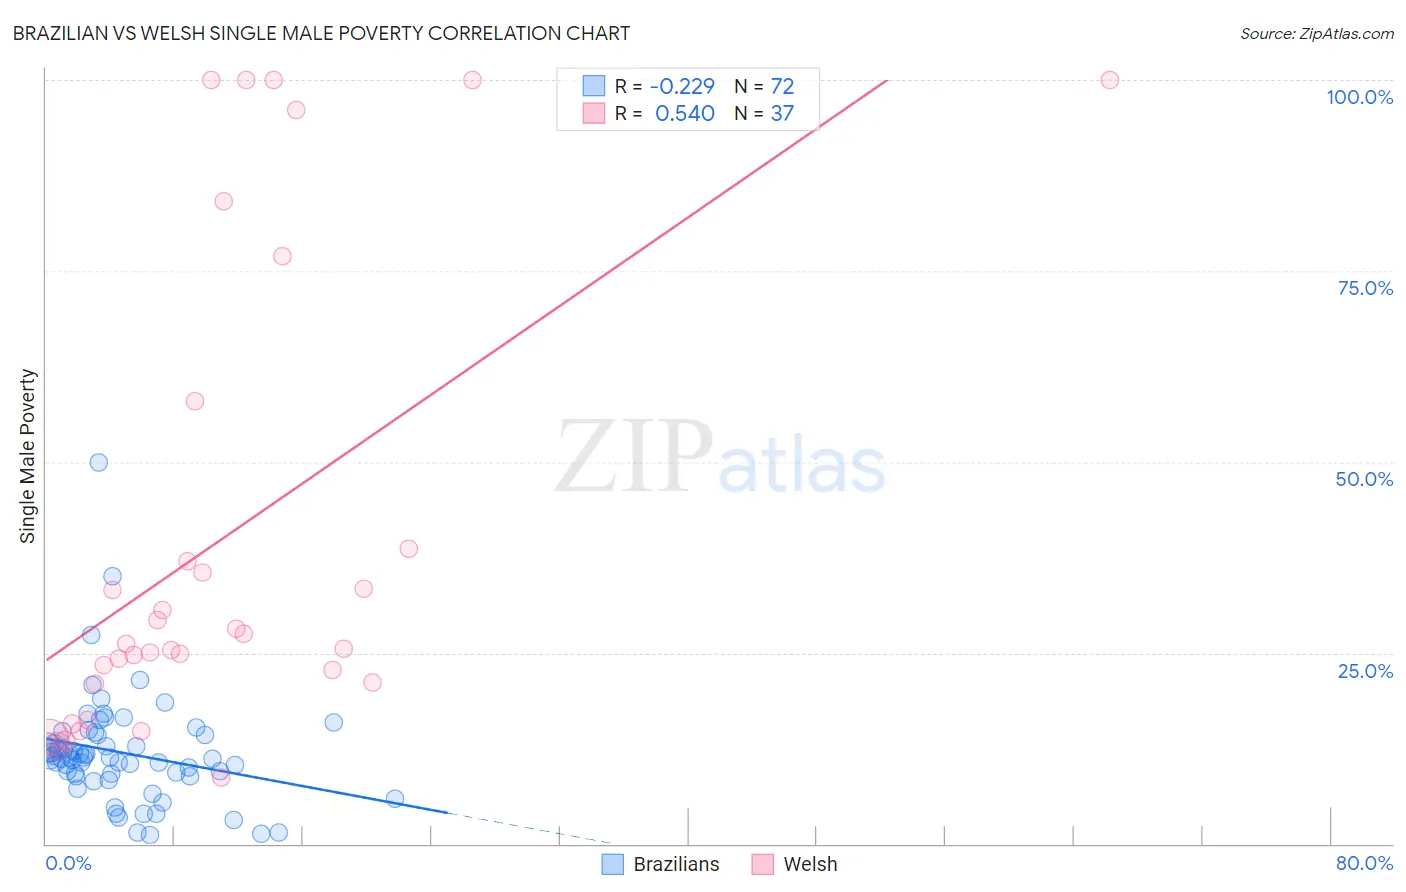
Brazilian vs Welsh Single Male Poverty Correlation Chart
The statistical analysis conducted on geographies consisting of 290,096,806 people shows a weak negative correlation between the proportion of Brazilians and poverty level among single males in the United States with a correlation coefficient (R) of -0.229 and weighted average of 11.8%. Similarly, the statistical analysis conducted on geographies consisting of 442,898,896 people shows a substantial positive correlation between the proportion of Welsh and poverty level among single males in the United States with a correlation coefficient (R) of 0.540 and weighted average of 14.0%, a difference of 19.4%.
Single Male Poverty Correlation Summary
| Measurement | Brazilian | Welsh |
| Minimum | 1.1% | 8.7% |
| Maximum | 50.0% | 100.0% |
| Range | 48.9% | 91.3% |
| Mean | 11.9% | 40.1% |
| Median | 11.3% | 26.2% |
| Interquartile 25% (IQ1) | 9.0% | 21.0% |
| Interquartile 75% (IQ3) | 14.3% | 48.3% |
| Interquartile Range (IQR) | 5.3% | 27.3% |
| Standard Deviation (Sample) | 7.3% | 30.6% |
| Standard Deviation (Population) | 7.2% | 30.2% |
Similar Demographics by Single Male Poverty
Demographics Similar to Brazilians by Single Male Poverty
In terms of single male poverty, the demographic groups most similar to Brazilians are Immigrants from Brazil (11.7%, a difference of 0.080%), Immigrants from Romania (11.7%, a difference of 0.11%), Peruvian (11.8%, a difference of 0.21%), Cambodian (11.8%, a difference of 0.23%), and Burmese (11.7%, a difference of 0.26%).
| Demographics | Rating | Rank | Single Male Poverty |
| Samoans | 99.9 /100 | #52 | Exceptional 11.7% |
| Bulgarians | 99.9 /100 | #53 | Exceptional 11.7% |
| Immigrants | Uzbekistan | 99.9 /100 | #54 | Exceptional 11.7% |
| Cypriots | 99.9 /100 | #55 | Exceptional 11.7% |
| Burmese | 99.8 /100 | #56 | Exceptional 11.7% |
| Immigrants | Romania | 99.8 /100 | #57 | Exceptional 11.7% |
| Immigrants | Brazil | 99.8 /100 | #58 | Exceptional 11.7% |
| Brazilians | 99.8 /100 | #59 | Exceptional 11.8% |
| Peruvians | 99.8 /100 | #60 | Exceptional 11.8% |
| Cambodians | 99.8 /100 | #61 | Exceptional 11.8% |
| Immigrants | Sri Lanka | 99.7 /100 | #62 | Exceptional 11.8% |
| Immigrants | Belarus | 99.7 /100 | #63 | Exceptional 11.8% |
| Immigrants | Eastern Europe | 99.6 /100 | #64 | Exceptional 11.8% |
| Laotians | 99.6 /100 | #65 | Exceptional 11.9% |
| Immigrants | Uruguay | 99.6 /100 | #66 | Exceptional 11.9% |
Demographics Similar to Welsh by Single Male Poverty
In terms of single male poverty, the demographic groups most similar to Welsh are Honduran (14.0%, a difference of 0.13%), English (14.1%, a difference of 0.21%), Dutch (14.1%, a difference of 0.32%), Mexican (14.0%, a difference of 0.35%), and Immigrants from Honduras (14.1%, a difference of 0.36%).
| Demographics | Rating | Rank | Single Male Poverty |
| Immigrants | Cabo Verde | 0.1 /100 | #266 | Tragic 13.9% |
| Germans | 0.1 /100 | #267 | Tragic 13.9% |
| Immigrants | Mexico | 0.1 /100 | #268 | Tragic 13.9% |
| Scottish | 0.1 /100 | #269 | Tragic 14.0% |
| Immigrants | Saudi Arabia | 0.1 /100 | #270 | Tragic 14.0% |
| Irish | 0.1 /100 | #271 | Tragic 14.0% |
| Mexicans | 0.1 /100 | #272 | Tragic 14.0% |
| Welsh | 0.1 /100 | #273 | Tragic 14.0% |
| Hondurans | 0.1 /100 | #274 | Tragic 14.0% |
| English | 0.1 /100 | #275 | Tragic 14.1% |
| Dutch | 0.1 /100 | #276 | Tragic 14.1% |
| Immigrants | Honduras | 0.0 /100 | #277 | Tragic 14.1% |
| Slovaks | 0.0 /100 | #278 | Tragic 14.1% |
| Indonesians | 0.0 /100 | #279 | Tragic 14.1% |
| Hmong | 0.0 /100 | #280 | Tragic 14.2% |