Black/African American vs Slovak Family Poverty
COMPARE
Black/African American
Slovak
Family Poverty
Family Poverty Comparison
Blacks/African Americans
Slovaks
13.3%
FAMILY POVERTY
0.0/ 100
METRIC RATING
329th/ 347
METRIC RANK
7.9%
FAMILY POVERTY
97.7/ 100
METRIC RATING
83rd/ 347
METRIC RANK
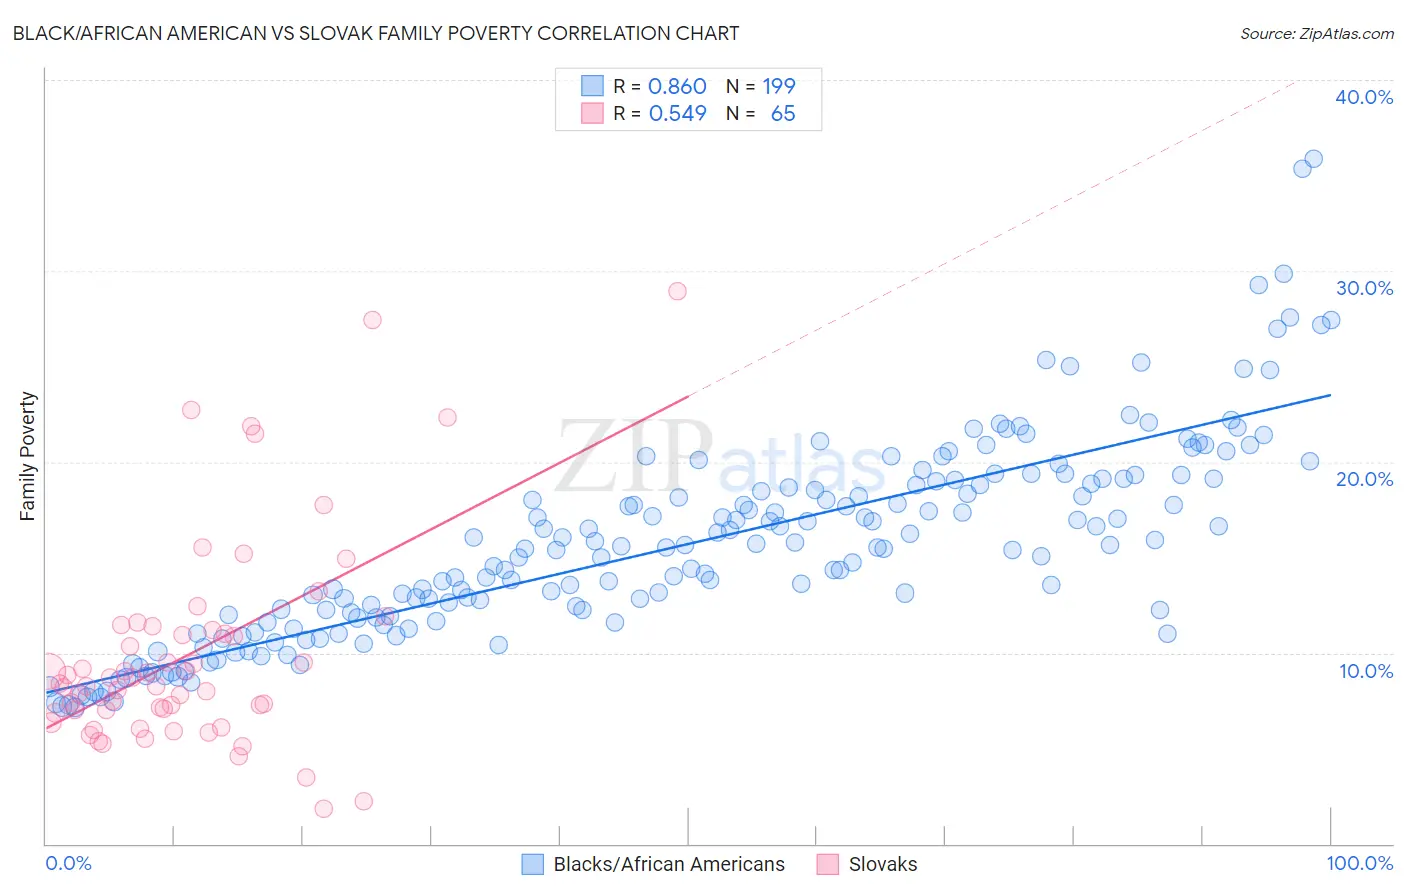
Black/African American vs Slovak Family Poverty Correlation Chart
The statistical analysis conducted on geographies consisting of 562,121,260 people shows a very strong positive correlation between the proportion of Blacks/African Americans and poverty level among families in the United States with a correlation coefficient (R) of 0.860 and weighted average of 13.3%. Similarly, the statistical analysis conducted on geographies consisting of 396,377,277 people shows a substantial positive correlation between the proportion of Slovaks and poverty level among families in the United States with a correlation coefficient (R) of 0.549 and weighted average of 7.9%, a difference of 68.7%.
Family Poverty Correlation Summary
| Measurement | Black/African American | Slovak |
| Minimum | 7.2% | 1.9% |
| Maximum | 35.9% | 28.9% |
| Range | 28.7% | 27.1% |
| Mean | 15.7% | 9.9% |
| Median | 15.5% | 8.4% |
| Interquartile 25% (IQ1) | 11.8% | 6.9% |
| Interquartile 75% (IQ3) | 18.8% | 11.3% |
| Interquartile Range (IQR) | 7.0% | 4.4% |
| Standard Deviation (Sample) | 5.2% | 5.5% |
| Standard Deviation (Population) | 5.2% | 5.5% |
Similar Demographics by Family Poverty
Demographics Similar to Blacks/African Americans by Family Poverty
In terms of family poverty, the demographic groups most similar to Blacks/African Americans are Central American Indian (13.3%, a difference of 0.17%), Yakama (13.1%, a difference of 1.8%), Colville (13.0%, a difference of 2.5%), Paiute (13.0%, a difference of 2.6%), and Immigrants from Dominica (12.7%, a difference of 4.6%).
| Demographics | Rating | Rank | Family Poverty |
| Immigrants | Honduras | 0.0 /100 | #322 | Tragic 12.7% |
| Menominee | 0.0 /100 | #323 | Tragic 12.7% |
| Immigrants | Dominica | 0.0 /100 | #324 | Tragic 12.7% |
| Paiute | 0.0 /100 | #325 | Tragic 13.0% |
| Colville | 0.0 /100 | #326 | Tragic 13.0% |
| Yakama | 0.0 /100 | #327 | Tragic 13.1% |
| Central American Indians | 0.0 /100 | #328 | Tragic 13.3% |
| Blacks/African Americans | 0.0 /100 | #329 | Tragic 13.3% |
| Natives/Alaskans | 0.0 /100 | #330 | Tragic 14.3% |
| Cheyenne | 0.0 /100 | #331 | Tragic 14.3% |
| Dominicans | 0.0 /100 | #332 | Tragic 14.3% |
| Immigrants | Dominican Republic | 0.0 /100 | #333 | Tragic 14.4% |
| Houma | 0.0 /100 | #334 | Tragic 14.6% |
| Apache | 0.0 /100 | #335 | Tragic 14.7% |
| Sioux | 0.0 /100 | #336 | Tragic 15.9% |
Demographics Similar to Slovaks by Family Poverty
In terms of family poverty, the demographic groups most similar to Slovaks are Immigrants from Poland (7.9%, a difference of 0.18%), Irish (7.9%, a difference of 0.20%), English (7.9%, a difference of 0.21%), British (7.9%, a difference of 0.24%), and Immigrants from Europe (7.9%, a difference of 0.27%).
| Demographics | Rating | Rank | Family Poverty |
| Immigrants | Latvia | 98.0 /100 | #76 | Exceptional 7.9% |
| Ukrainians | 98.0 /100 | #77 | Exceptional 7.9% |
| Immigrants | North America | 97.9 /100 | #78 | Exceptional 7.9% |
| Immigrants | Europe | 97.8 /100 | #79 | Exceptional 7.9% |
| English | 97.8 /100 | #80 | Exceptional 7.9% |
| Irish | 97.8 /100 | #81 | Exceptional 7.9% |
| Immigrants | Poland | 97.8 /100 | #82 | Exceptional 7.9% |
| Slovaks | 97.7 /100 | #83 | Exceptional 7.9% |
| British | 97.5 /100 | #84 | Exceptional 7.9% |
| Immigrants | Asia | 97.4 /100 | #85 | Exceptional 7.9% |
| Scottish | 97.3 /100 | #86 | Exceptional 7.9% |
| Belgians | 97.3 /100 | #87 | Exceptional 8.0% |
| Serbians | 97.2 /100 | #88 | Exceptional 8.0% |
| Immigrants | Denmark | 97.1 /100 | #89 | Exceptional 8.0% |
| Immigrants | England | 97.1 /100 | #90 | Exceptional 8.0% |