Black/African American vs Senegalese Seniors Poverty Over the Age of 65
COMPARE
Black/African American
Senegalese
Seniors Poverty Over the Age of 65
Seniors Poverty Over the Age of 65 Comparison
Blacks/African Americans
Senegalese
13.7%
SENIORS POVERTY OVER THE AGE OF 65
0.0/ 100
METRIC RATING
291st/ 347
METRIC RANK
13.3%
SENIORS POVERTY OVER THE AGE OF 65
0.0/ 100
METRIC RATING
282nd/ 347
METRIC RANK
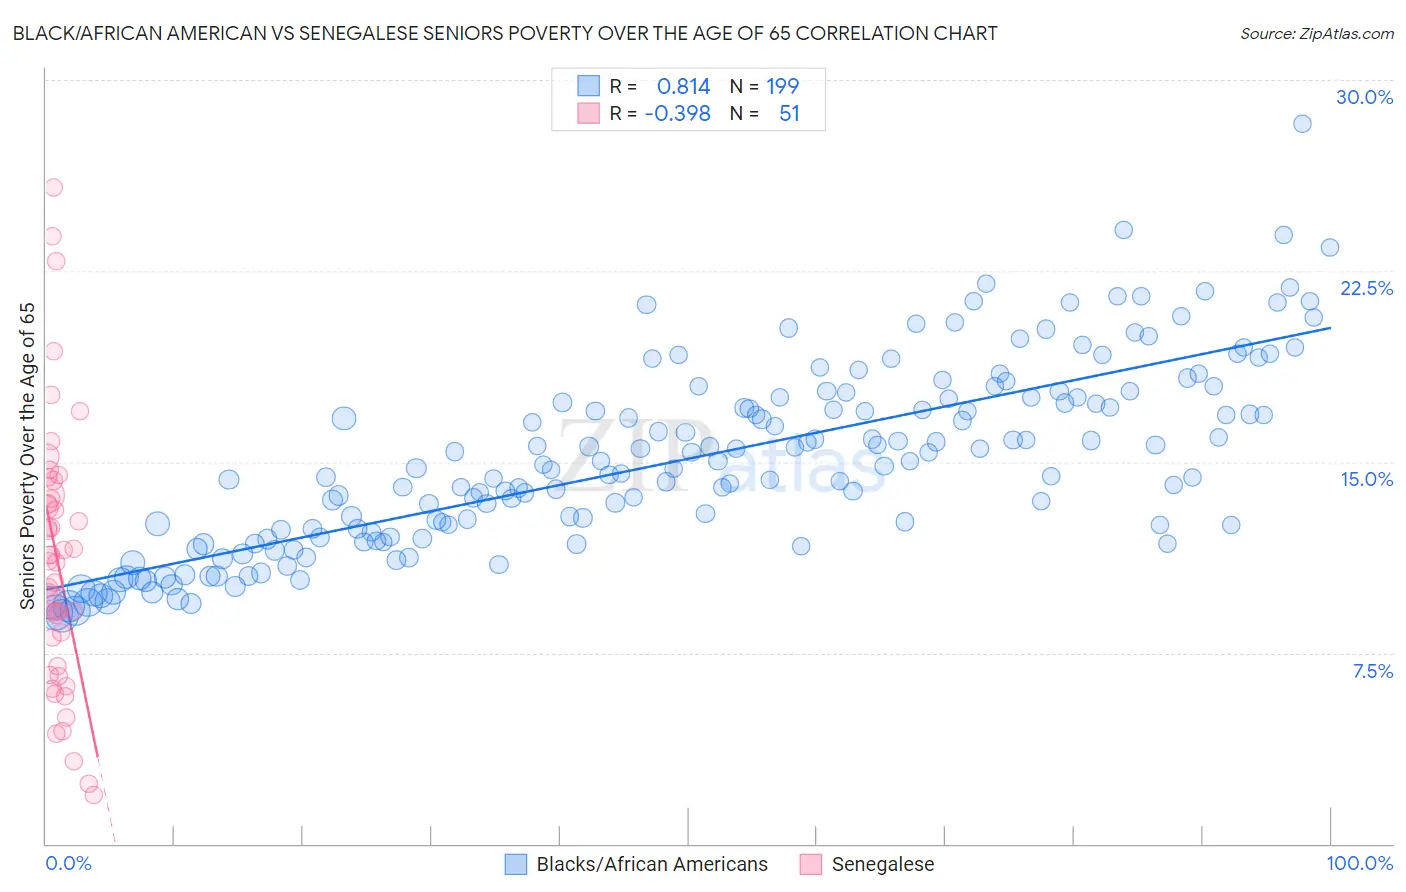
Black/African American vs Senegalese Seniors Poverty Over the Age of 65 Correlation Chart
The statistical analysis conducted on geographies consisting of 561,317,692 people shows a very strong positive correlation between the proportion of Blacks/African Americans and poverty level among seniors over the age of 65 in the United States with a correlation coefficient (R) of 0.814 and weighted average of 13.7%. Similarly, the statistical analysis conducted on geographies consisting of 77,978,779 people shows a mild negative correlation between the proportion of Senegalese and poverty level among seniors over the age of 65 in the United States with a correlation coefficient (R) of -0.398 and weighted average of 13.3%, a difference of 3.3%.
Seniors Poverty Over the Age of 65 Correlation Summary
| Measurement | Black/African American | Senegalese |
| Minimum | 9.0% | 1.9% |
| Maximum | 28.3% | 25.8% |
| Range | 19.3% | 23.9% |
| Mean | 15.1% | 11.1% |
| Median | 14.8% | 11.1% |
| Interquartile 25% (IQ1) | 12.0% | 7.0% |
| Interquartile 75% (IQ3) | 17.5% | 13.7% |
| Interquartile Range (IQR) | 5.5% | 6.7% |
| Standard Deviation (Sample) | 3.6% | 5.2% |
| Standard Deviation (Population) | 3.6% | 5.1% |
Demographics Similar to Blacks/African Americans and Senegalese by Seniors Poverty Over the Age of 65
In terms of seniors poverty over the age of 65, the demographic groups most similar to Blacks/African Americans are Jamaican (13.6%, a difference of 0.46%), Immigrants from Central America (13.6%, a difference of 0.46%), Spanish American Indian (13.8%, a difference of 0.69%), Belizean (13.6%, a difference of 0.73%), and Immigrants from Mexico (13.6%, a difference of 0.87%). Similarly, the demographic groups most similar to Senegalese are Central American (13.4%, a difference of 0.82%), Immigrants from El Salvador (13.1%, a difference of 1.1%), Yuman (13.1%, a difference of 1.5%), Mexican (13.1%, a difference of 1.6%), and Immigrants from Bahamas (13.0%, a difference of 1.7%).
| Demographics | Rating | Rank | Seniors Poverty Over the Age of 65 |
| Immigrants | Azores | 0.0 /100 | #276 | Tragic 12.9% |
| Paiute | 0.0 /100 | #277 | Tragic 12.9% |
| Immigrants | Bahamas | 0.0 /100 | #278 | Tragic 13.0% |
| Mexicans | 0.0 /100 | #279 | Tragic 13.1% |
| Yuman | 0.0 /100 | #280 | Tragic 13.1% |
| Immigrants | El Salvador | 0.0 /100 | #281 | Tragic 13.1% |
| Senegalese | 0.0 /100 | #282 | Tragic 13.3% |
| Central Americans | 0.0 /100 | #283 | Tragic 13.4% |
| Colville | 0.0 /100 | #284 | Tragic 13.5% |
| Guatemalans | 0.0 /100 | #285 | Tragic 13.5% |
| Immigrants | Senegal | 0.0 /100 | #286 | Tragic 13.6% |
| Immigrants | Mexico | 0.0 /100 | #287 | Tragic 13.6% |
| Belizeans | 0.0 /100 | #288 | Tragic 13.6% |
| Jamaicans | 0.0 /100 | #289 | Tragic 13.6% |
| Immigrants | Central America | 0.0 /100 | #290 | Tragic 13.6% |
| Blacks/African Americans | 0.0 /100 | #291 | Tragic 13.7% |
| Spanish American Indians | 0.0 /100 | #292 | Tragic 13.8% |
| Immigrants | Guatemala | 0.0 /100 | #293 | Tragic 13.8% |
| Cheyenne | 0.0 /100 | #294 | Tragic 13.9% |
| Apache | 0.0 /100 | #295 | Tragic 13.9% |
| Immigrants | Jamaica | 0.0 /100 | #296 | Tragic 13.9% |