Immigrants from Somalia vs Albanian Male Poverty
COMPARE
Immigrants from Somalia
Albanian
Male Poverty
Male Poverty Comparison
Immigrants from Somalia
Albanians
14.6%
MALE POVERTY
0.0/ 100
METRIC RATING
313th/ 347
METRIC RANK
10.6%
MALE POVERTY
90.6/ 100
METRIC RATING
109th/ 347
METRIC RANK
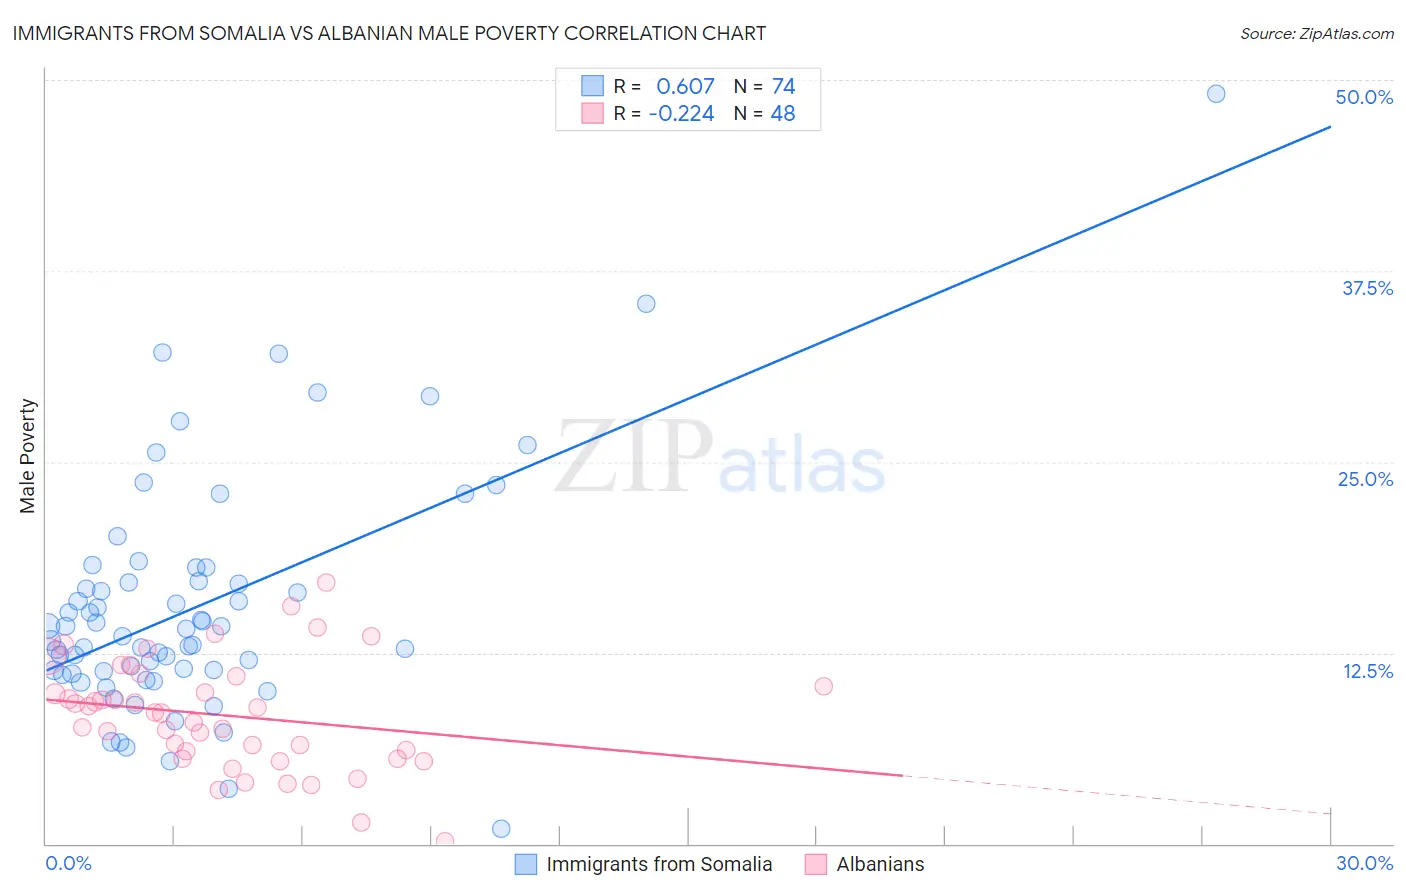
Immigrants from Somalia vs Albanian Male Poverty Correlation Chart
The statistical analysis conducted on geographies consisting of 92,092,836 people shows a significant positive correlation between the proportion of Immigrants from Somalia and poverty level among males in the United States with a correlation coefficient (R) of 0.607 and weighted average of 14.6%. Similarly, the statistical analysis conducted on geographies consisting of 193,144,677 people shows a weak negative correlation between the proportion of Albanians and poverty level among males in the United States with a correlation coefficient (R) of -0.224 and weighted average of 10.6%, a difference of 38.0%.
Male Poverty Correlation Summary
| Measurement | Immigrants from Somalia | Albanian |
| Minimum | 1.0% | 0.15% |
| Maximum | 49.1% | 17.1% |
| Range | 48.1% | 17.0% |
| Mean | 15.5% | 8.4% |
| Median | 13.8% | 8.6% |
| Interquartile 25% (IQ1) | 11.3% | 5.8% |
| Interquartile 75% (IQ3) | 17.2% | 10.6% |
| Interquartile Range (IQR) | 5.9% | 4.8% |
| Standard Deviation (Sample) | 7.8% | 3.6% |
| Standard Deviation (Population) | 7.7% | 3.6% |
Similar Demographics by Male Poverty
Demographics Similar to Immigrants from Somalia by Male Poverty
In terms of male poverty, the demographic groups most similar to Immigrants from Somalia are Immigrants from Honduras (14.6%, a difference of 0.040%), Chippewa (14.6%, a difference of 0.11%), British West Indian (14.6%, a difference of 0.14%), Immigrants from Dominica (14.7%, a difference of 0.82%), and Immigrants from Grenada (14.7%, a difference of 0.87%).
| Demographics | Rating | Rank | Male Poverty |
| Creek | 0.0 /100 | #306 | Tragic 14.1% |
| Dutch West Indians | 0.0 /100 | #307 | Tragic 14.2% |
| Africans | 0.0 /100 | #308 | Tragic 14.2% |
| Somalis | 0.0 /100 | #309 | Tragic 14.3% |
| Seminole | 0.0 /100 | #310 | Tragic 14.3% |
| Hondurans | 0.0 /100 | #311 | Tragic 14.3% |
| Choctaw | 0.0 /100 | #312 | Tragic 14.4% |
| Immigrants | Somalia | 0.0 /100 | #313 | Tragic 14.6% |
| Immigrants | Honduras | 0.0 /100 | #314 | Tragic 14.6% |
| Chippewa | 0.0 /100 | #315 | Tragic 14.6% |
| British West Indians | 0.0 /100 | #316 | Tragic 14.6% |
| Immigrants | Dominica | 0.0 /100 | #317 | Tragic 14.7% |
| Immigrants | Grenada | 0.0 /100 | #318 | Tragic 14.7% |
| U.S. Virgin Islanders | 0.0 /100 | #319 | Tragic 14.7% |
| Immigrants | Congo | 0.0 /100 | #320 | Tragic 14.7% |
Demographics Similar to Albanians by Male Poverty
In terms of male poverty, the demographic groups most similar to Albanians are Portuguese (10.6%, a difference of 0.13%), Argentinean (10.6%, a difference of 0.13%), Immigrants from Southern Europe (10.5%, a difference of 0.21%), Laotian (10.5%, a difference of 0.21%), and Immigrants from Argentina (10.6%, a difference of 0.24%).
| Demographics | Rating | Rank | Male Poverty |
| French Canadians | 91.9 /100 | #102 | Exceptional 10.5% |
| Slavs | 91.7 /100 | #103 | Exceptional 10.5% |
| Welsh | 91.6 /100 | #104 | Exceptional 10.5% |
| Canadians | 91.6 /100 | #105 | Exceptional 10.5% |
| Immigrants | Southern Europe | 91.3 /100 | #106 | Exceptional 10.5% |
| Laotians | 91.2 /100 | #107 | Exceptional 10.5% |
| Portuguese | 91.0 /100 | #108 | Exceptional 10.6% |
| Albanians | 90.6 /100 | #109 | Exceptional 10.6% |
| Argentineans | 90.1 /100 | #110 | Exceptional 10.6% |
| Immigrants | Argentina | 89.8 /100 | #111 | Excellent 10.6% |
| Immigrants | Turkey | 89.5 /100 | #112 | Excellent 10.6% |
| Palestinians | 89.1 /100 | #113 | Excellent 10.6% |
| Immigrants | Brazil | 89.0 /100 | #114 | Excellent 10.6% |
| Immigrants | Russia | 88.6 /100 | #115 | Excellent 10.6% |
| Sri Lankans | 88.1 /100 | #116 | Excellent 10.6% |