Blackfeet vs Northern European Average Family Size
COMPARE
Blackfeet
Northern European
Average Family Size
Average Family Size Comparison
Blackfeet
Northern Europeans
3.24
AVERAGE FAMILY SIZE
75.0/ 100
METRIC RATING
148th/ 347
METRIC RANK
3.13
AVERAGE FAMILY SIZE
0.1/ 100
METRIC RATING
309th/ 347
METRIC RANK
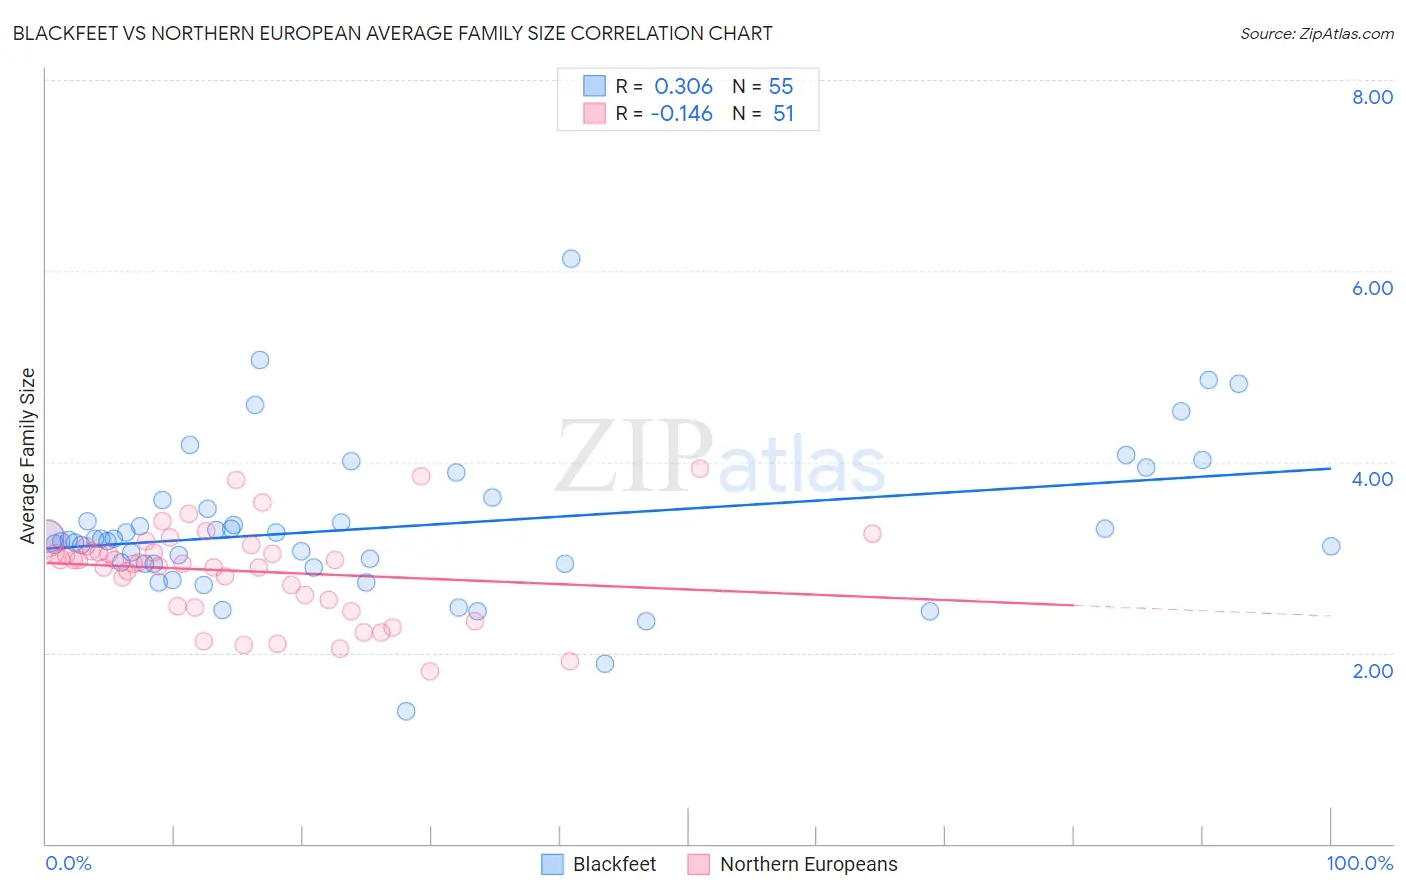
Blackfeet vs Northern European Average Family Size Correlation Chart
The statistical analysis conducted on geographies consisting of 309,476,508 people shows a mild positive correlation between the proportion of Blackfeet and average family size in the United States with a correlation coefficient (R) of 0.306 and weighted average of 3.24. Similarly, the statistical analysis conducted on geographies consisting of 405,947,196 people shows a poor negative correlation between the proportion of Northern Europeans and average family size in the United States with a correlation coefficient (R) of -0.146 and weighted average of 3.13, a difference of 3.7%.
Average Family Size Correlation Summary
| Measurement | Blackfeet | Northern European |
| Minimum | 1.39 | 1.81 |
| Maximum | 6.13 | 3.93 |
| Range | 4.74 | 2.12 |
| Mean | 3.32 | 2.86 |
| Median | 3.19 | 2.95 |
| Interquartile 25% (IQ1) | 2.93 | 2.49 |
| Interquartile 75% (IQ3) | 3.60 | 3.12 |
| Interquartile Range (IQR) | 0.67 | 0.63 |
| Standard Deviation (Sample) | 0.80 | 0.49 |
| Standard Deviation (Population) | 0.79 | 0.48 |
Similar Demographics by Average Family Size
Demographics Similar to Blackfeet by Average Family Size
In terms of average family size, the demographic groups most similar to Blackfeet are Immigrants from Jordan (3.24, a difference of 0.020%), Assyrian/Chaldean/Syriac (3.24, a difference of 0.030%), Indian (Asian) (3.24, a difference of 0.030%), Jordanian (3.24, a difference of 0.040%), and Spanish American (3.24, a difference of 0.060%).
| Demographics | Rating | Rank | Average Family Size |
| Venezuelans | 81.4 /100 | #141 | Excellent 3.25 |
| Liberians | 81.2 /100 | #142 | Excellent 3.25 |
| Bhutanese | 81.0 /100 | #143 | Excellent 3.25 |
| Tsimshian | 80.2 /100 | #144 | Excellent 3.25 |
| Armenians | 78.2 /100 | #145 | Good 3.25 |
| Immigrants | Africa | 77.9 /100 | #146 | Good 3.25 |
| Immigrants | Jordan | 75.7 /100 | #147 | Good 3.24 |
| Blackfeet | 75.0 /100 | #148 | Good 3.24 |
| Assyrians/Chaldeans/Syriacs | 73.8 /100 | #149 | Good 3.24 |
| Indians (Asian) | 73.6 /100 | #150 | Good 3.24 |
| Jordanians | 73.5 /100 | #151 | Good 3.24 |
| Spanish Americans | 72.5 /100 | #152 | Good 3.24 |
| Immigrants | Eritrea | 71.4 /100 | #153 | Good 3.24 |
| Immigrants | Egypt | 70.0 /100 | #154 | Good 3.24 |
| Seminole | 68.2 /100 | #155 | Good 3.24 |
Demographics Similar to Northern Europeans by Average Family Size
In terms of average family size, the demographic groups most similar to Northern Europeans are Slavic (3.13, a difference of 0.010%), Czechoslovakian (3.13, a difference of 0.020%), Immigrants from Ireland (3.13, a difference of 0.060%), Immigrants from Serbia (3.13, a difference of 0.060%), and Immigrants from Northern Europe (3.13, a difference of 0.060%).
| Demographics | Rating | Rank | Average Family Size |
| Immigrants | Latvia | 0.2 /100 | #302 | Tragic 3.13 |
| British | 0.2 /100 | #303 | Tragic 3.13 |
| Immigrants | Switzerland | 0.2 /100 | #304 | Tragic 3.13 |
| Australians | 0.1 /100 | #305 | Tragic 3.13 |
| Immigrants | Ireland | 0.1 /100 | #306 | Tragic 3.13 |
| Immigrants | Serbia | 0.1 /100 | #307 | Tragic 3.13 |
| Slavs | 0.1 /100 | #308 | Tragic 3.13 |
| Northern Europeans | 0.1 /100 | #309 | Tragic 3.13 |
| Czechoslovakians | 0.1 /100 | #310 | Tragic 3.13 |
| Immigrants | Northern Europe | 0.1 /100 | #311 | Tragic 3.13 |
| Immigrants | Australia | 0.1 /100 | #312 | Tragic 3.13 |
| Bulgarians | 0.1 /100 | #313 | Tragic 3.13 |
| Russians | 0.1 /100 | #314 | Tragic 3.12 |
| Immigrants | Scotland | 0.1 /100 | #315 | Tragic 3.12 |
| Serbians | 0.1 /100 | #316 | Tragic 3.12 |