Blackfeet vs Immigrants from Laos Single Male Poverty
COMPARE
Blackfeet
Immigrants from Laos
Single Male Poverty
Single Male Poverty Comparison
Blackfeet
Immigrants from Laos
15.5%
SINGLE MALE POVERTY
0.0/ 100
METRIC RATING
305th/ 347
METRIC RANK
13.0%
SINGLE MALE POVERTY
23.1/ 100
METRIC RATING
197th/ 347
METRIC RANK
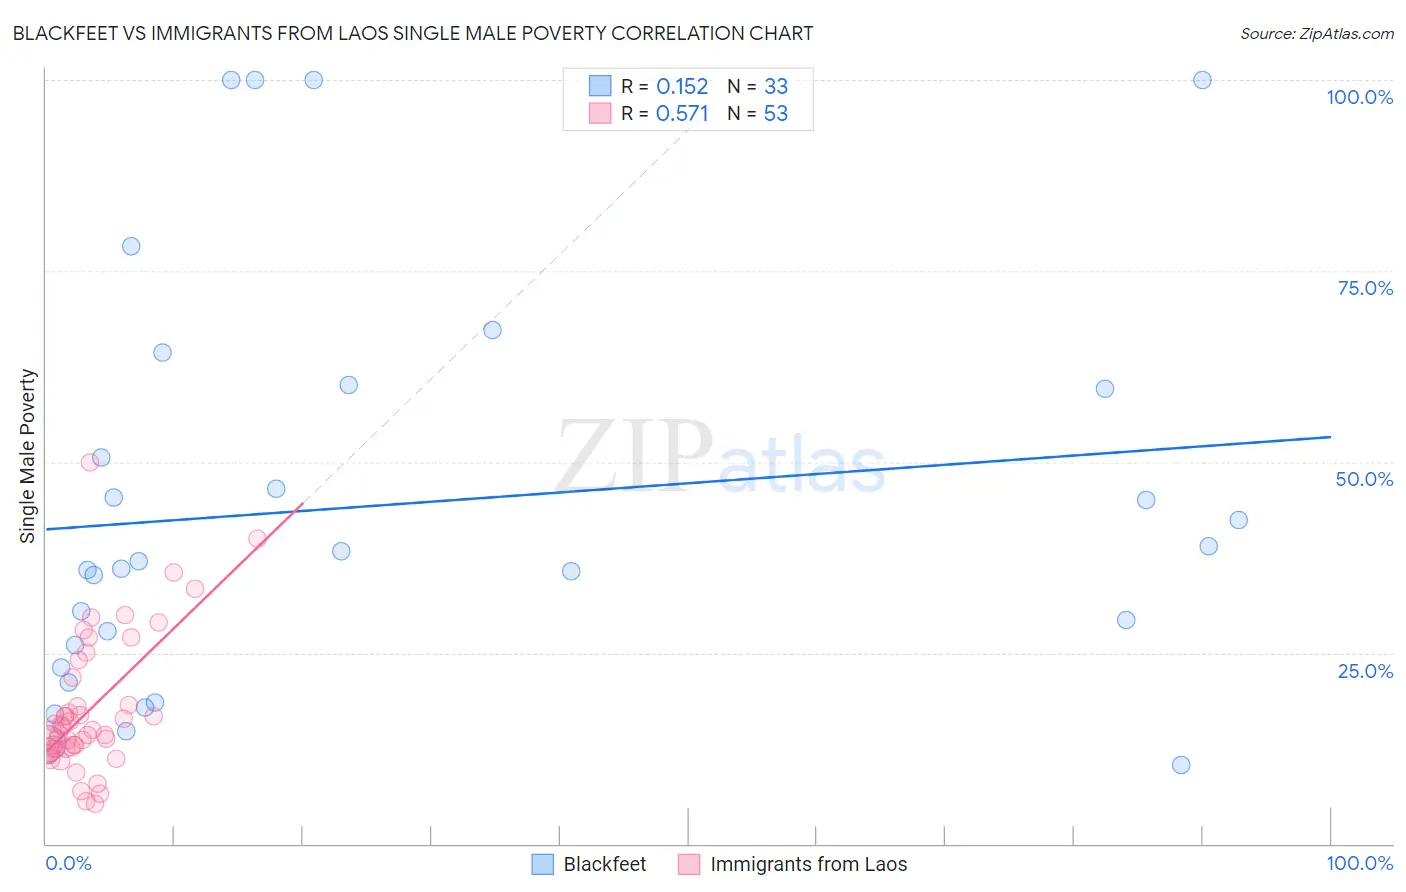
Blackfeet vs Immigrants from Laos Single Male Poverty Correlation Chart
The statistical analysis conducted on geographies consisting of 285,257,695 people shows a poor positive correlation between the proportion of Blackfeet and poverty level among single males in the United States with a correlation coefficient (R) of 0.152 and weighted average of 15.5%. Similarly, the statistical analysis conducted on geographies consisting of 188,644,362 people shows a substantial positive correlation between the proportion of Immigrants from Laos and poverty level among single males in the United States with a correlation coefficient (R) of 0.571 and weighted average of 13.0%, a difference of 19.2%.
Single Male Poverty Correlation Summary
| Measurement | Blackfeet | Immigrants from Laos |
| Minimum | 10.3% | 5.2% |
| Maximum | 100.0% | 50.0% |
| Range | 89.7% | 44.8% |
| Mean | 44.4% | 17.5% |
| Median | 37.0% | 14.8% |
| Interquartile 25% (IQ1) | 24.6% | 12.4% |
| Interquartile 75% (IQ3) | 59.8% | 19.9% |
| Interquartile Range (IQR) | 35.2% | 7.5% |
| Standard Deviation (Sample) | 26.6% | 9.0% |
| Standard Deviation (Population) | 26.1% | 8.9% |
Similar Demographics by Single Male Poverty
Demographics Similar to Blackfeet by Single Male Poverty
In terms of single male poverty, the demographic groups most similar to Blackfeet are Pennsylvania German (15.6%, a difference of 0.43%), Alaska Native (15.4%, a difference of 0.53%), Aleut (15.4%, a difference of 0.64%), Ute (15.7%, a difference of 1.2%), and Alsatian (15.2%, a difference of 1.7%).
| Demographics | Rating | Rank | Single Male Poverty |
| French American Indians | 0.0 /100 | #298 | Tragic 15.0% |
| Delaware | 0.0 /100 | #299 | Tragic 15.0% |
| Cree | 0.0 /100 | #300 | Tragic 15.1% |
| Dominicans | 0.0 /100 | #301 | Tragic 15.2% |
| Alsatians | 0.0 /100 | #302 | Tragic 15.2% |
| Aleuts | 0.0 /100 | #303 | Tragic 15.4% |
| Alaska Natives | 0.0 /100 | #304 | Tragic 15.4% |
| Blackfeet | 0.0 /100 | #305 | Tragic 15.5% |
| Pennsylvania Germans | 0.0 /100 | #306 | Tragic 15.6% |
| Ute | 0.0 /100 | #307 | Tragic 15.7% |
| Potawatomi | 0.0 /100 | #308 | Tragic 15.8% |
| Americans | 0.0 /100 | #309 | Tragic 15.8% |
| Yakama | 0.0 /100 | #310 | Tragic 15.9% |
| Seminole | 0.0 /100 | #311 | Tragic 16.0% |
| Comanche | 0.0 /100 | #312 | Tragic 16.0% |
Demographics Similar to Immigrants from Laos by Single Male Poverty
In terms of single male poverty, the demographic groups most similar to Immigrants from Laos are Immigrants from Grenada (13.0%, a difference of 0.0%), Immigrants from England (13.0%, a difference of 0.020%), Lithuanian (13.0%, a difference of 0.070%), Immigrants from Norway (13.0%, a difference of 0.10%), and Slovene (13.0%, a difference of 0.11%).
| Demographics | Rating | Rank | Single Male Poverty |
| Arabs | 27.0 /100 | #190 | Fair 13.0% |
| Immigrants | Thailand | 26.6 /100 | #191 | Fair 13.0% |
| Immigrants | Jamaica | 26.5 /100 | #192 | Fair 13.0% |
| Immigrants | South Africa | 26.1 /100 | #193 | Fair 13.0% |
| Liberians | 25.2 /100 | #194 | Fair 13.0% |
| Immigrants | England | 23.4 /100 | #195 | Fair 13.0% |
| Immigrants | Grenada | 23.1 /100 | #196 | Fair 13.0% |
| Immigrants | Laos | 23.1 /100 | #197 | Fair 13.0% |
| Lithuanians | 22.1 /100 | #198 | Fair 13.0% |
| Immigrants | Norway | 21.8 /100 | #199 | Fair 13.0% |
| Slovenes | 21.6 /100 | #200 | Fair 13.0% |
| Trinidadians and Tobagonians | 21.4 /100 | #201 | Fair 13.0% |
| Basques | 20.7 /100 | #202 | Fair 13.0% |
| Immigrants | Bangladesh | 20.4 /100 | #203 | Fair 13.0% |
| Estonians | 20.3 /100 | #204 | Fair 13.0% |