Blackfeet vs Mexican Female Poverty
COMPARE
Blackfeet
Mexican
Female Poverty
Female Poverty Comparison
Blackfeet
Mexicans
16.4%
FEMALE POVERTY
0.0/ 100
METRIC RATING
289th/ 347
METRIC RANK
16.5%
FEMALE POVERTY
0.0/ 100
METRIC RATING
297th/ 347
METRIC RANK
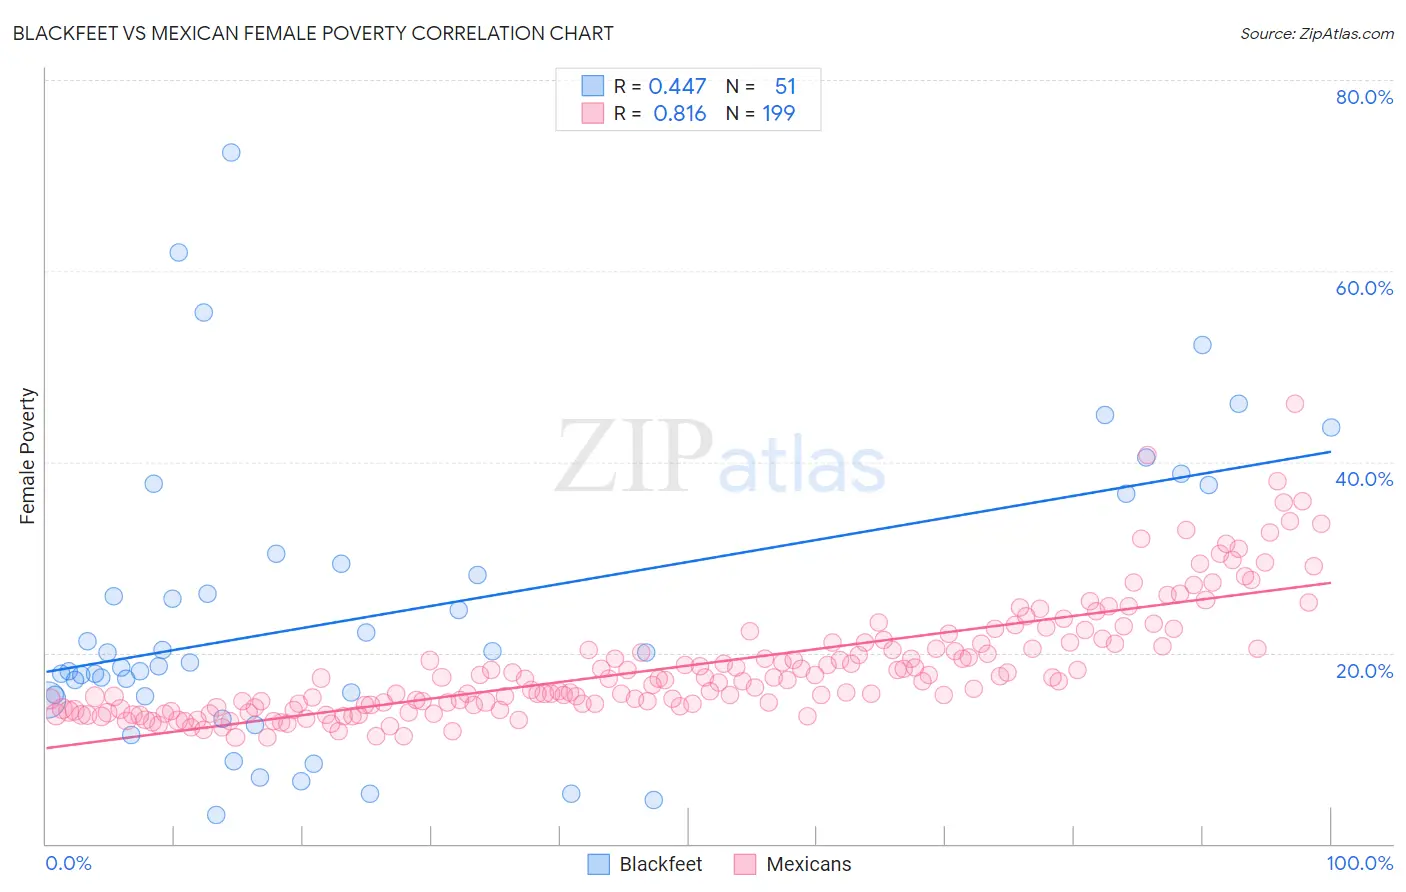
Blackfeet vs Mexican Female Poverty Correlation Chart
The statistical analysis conducted on geographies consisting of 309,450,114 people shows a moderate positive correlation between the proportion of Blackfeet and poverty level among females in the United States with a correlation coefficient (R) of 0.447 and weighted average of 16.4%. Similarly, the statistical analysis conducted on geographies consisting of 564,122,541 people shows a very strong positive correlation between the proportion of Mexicans and poverty level among females in the United States with a correlation coefficient (R) of 0.816 and weighted average of 16.5%, a difference of 0.95%.
Female Poverty Correlation Summary
| Measurement | Blackfeet | Mexican |
| Minimum | 3.0% | 11.1% |
| Maximum | 72.4% | 46.1% |
| Range | 69.4% | 35.0% |
| Mean | 24.1% | 18.6% |
| Median | 19.0% | 17.2% |
| Interquartile 25% (IQ1) | 15.5% | 14.3% |
| Interquartile 75% (IQ3) | 30.4% | 20.9% |
| Interquartile Range (IQR) | 14.9% | 6.6% |
| Standard Deviation (Sample) | 15.4% | 6.1% |
| Standard Deviation (Population) | 15.2% | 6.1% |
Demographics Similar to Blackfeet and Mexicans by Female Poverty
In terms of female poverty, the demographic groups most similar to Blackfeet are Indonesian (16.4%, a difference of 0.010%), Immigrants from Bangladesh (16.4%, a difference of 0.19%), Yaqui (16.4%, a difference of 0.36%), Immigrants from Zaire (16.4%, a difference of 0.37%), and Immigrants from Latin America (16.4%, a difference of 0.42%). Similarly, the demographic groups most similar to Mexicans are Somali (16.6%, a difference of 0.20%), Immigrants from Senegal (16.5%, a difference of 0.40%), Senegalese (16.5%, a difference of 0.42%), Immigrants from Cabo Verde (16.4%, a difference of 0.49%), and Immigrants from Latin America (16.4%, a difference of 0.53%).
| Demographics | Rating | Rank | Female Poverty |
| Immigrants | Cuba | 0.0 /100 | #283 | Tragic 16.1% |
| Spanish Americans | 0.0 /100 | #284 | Tragic 16.2% |
| Comanche | 0.0 /100 | #285 | Tragic 16.2% |
| Inupiat | 0.0 /100 | #286 | Tragic 16.2% |
| Immigrants | Belize | 0.0 /100 | #287 | Tragic 16.3% |
| Indonesians | 0.0 /100 | #288 | Tragic 16.4% |
| Blackfeet | 0.0 /100 | #289 | Tragic 16.4% |
| Immigrants | Bangladesh | 0.0 /100 | #290 | Tragic 16.4% |
| Yaqui | 0.0 /100 | #291 | Tragic 16.4% |
| Immigrants | Zaire | 0.0 /100 | #292 | Tragic 16.4% |
| Immigrants | Latin America | 0.0 /100 | #293 | Tragic 16.4% |
| Immigrants | Cabo Verde | 0.0 /100 | #294 | Tragic 16.4% |
| Senegalese | 0.0 /100 | #295 | Tragic 16.5% |
| Immigrants | Senegal | 0.0 /100 | #296 | Tragic 16.5% |
| Mexicans | 0.0 /100 | #297 | Tragic 16.5% |
| Somalis | 0.0 /100 | #298 | Tragic 16.6% |
| Hispanics or Latinos | 0.0 /100 | #299 | Tragic 16.6% |
| Bahamians | 0.0 /100 | #300 | Tragic 16.6% |
| Guatemalans | 0.0 /100 | #301 | Tragic 16.7% |
| Chippewa | 0.0 /100 | #302 | Tragic 16.7% |
| Choctaw | 0.0 /100 | #303 | Tragic 16.8% |