Immigrants from Moldova vs Mexican Female Poverty
COMPARE
Immigrants from Moldova
Mexican
Female Poverty
Female Poverty Comparison
Immigrants from Moldova
Mexicans
11.9%
FEMALE POVERTY
99.2/ 100
METRIC RATING
42nd/ 347
METRIC RANK
16.5%
FEMALE POVERTY
0.0/ 100
METRIC RATING
297th/ 347
METRIC RANK
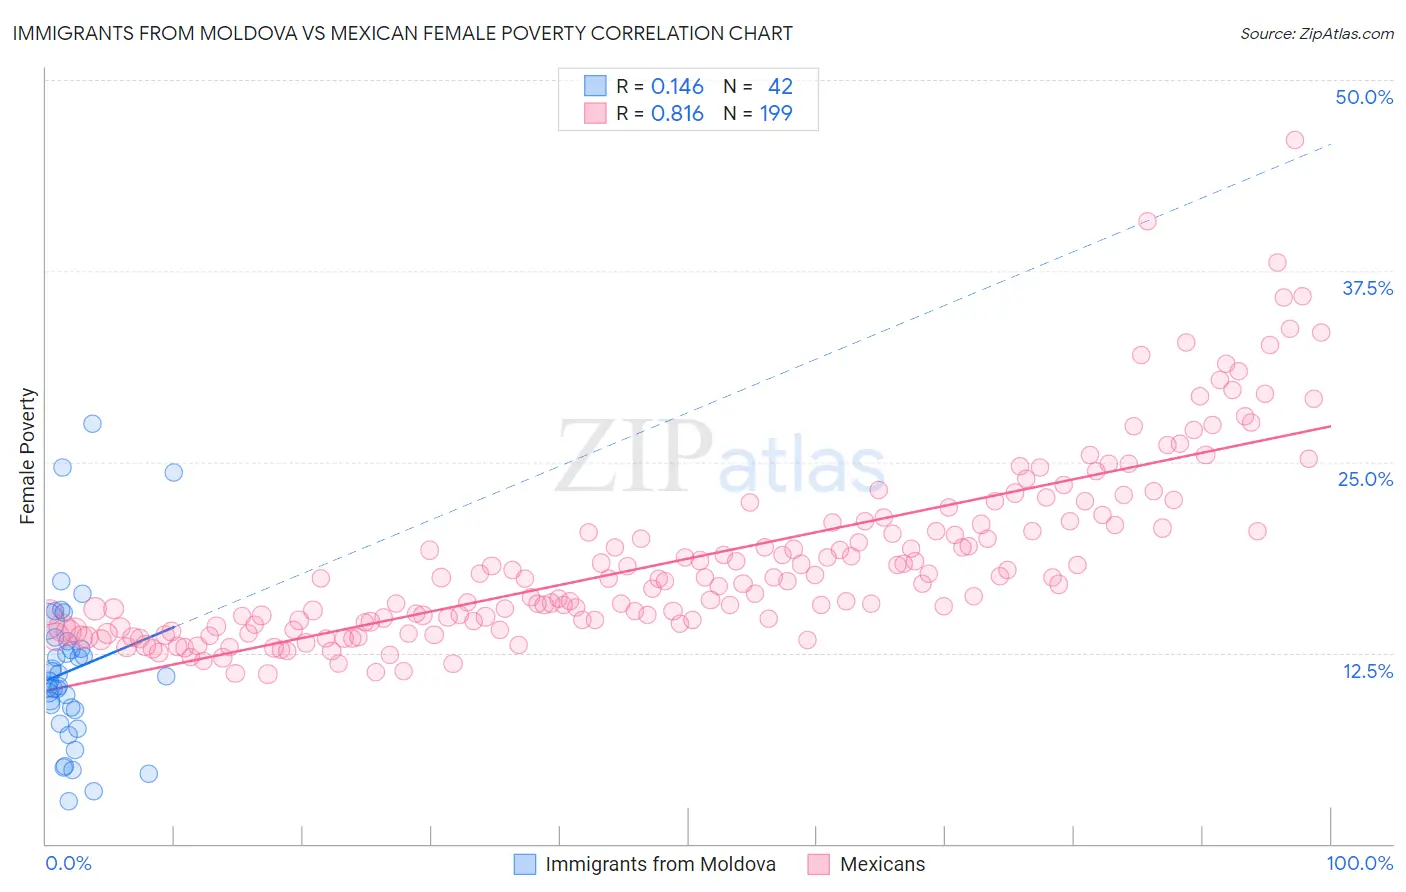
Immigrants from Moldova vs Mexican Female Poverty Correlation Chart
The statistical analysis conducted on geographies consisting of 124,368,843 people shows a poor positive correlation between the proportion of Immigrants from Moldova and poverty level among females in the United States with a correlation coefficient (R) of 0.146 and weighted average of 11.9%. Similarly, the statistical analysis conducted on geographies consisting of 564,122,541 people shows a very strong positive correlation between the proportion of Mexicans and poverty level among females in the United States with a correlation coefficient (R) of 0.816 and weighted average of 16.5%, a difference of 39.2%.
Female Poverty Correlation Summary
| Measurement | Immigrants from Moldova | Mexican |
| Minimum | 2.8% | 11.1% |
| Maximum | 27.5% | 46.1% |
| Range | 24.7% | 35.0% |
| Mean | 11.4% | 18.6% |
| Median | 10.8% | 17.2% |
| Interquartile 25% (IQ1) | 8.7% | 14.3% |
| Interquartile 75% (IQ3) | 13.3% | 20.9% |
| Interquartile Range (IQR) | 4.6% | 6.6% |
| Standard Deviation (Sample) | 5.3% | 6.1% |
| Standard Deviation (Population) | 5.2% | 6.1% |
Similar Demographics by Female Poverty
Demographics Similar to Immigrants from Moldova by Female Poverty
In terms of female poverty, the demographic groups most similar to Immigrants from Moldova are Czech (11.9%, a difference of 0.0%), Korean (11.9%, a difference of 0.040%), Tongan (11.9%, a difference of 0.11%), Macedonian (11.8%, a difference of 0.18%), and Immigrants from Czechoslovakia (11.9%, a difference of 0.20%).
| Demographics | Rating | Rank | Female Poverty |
| Immigrants | Iran | 99.4 /100 | #35 | Exceptional 11.8% |
| Immigrants | Pakistan | 99.4 /100 | #36 | Exceptional 11.8% |
| Immigrants | Greece | 99.3 /100 | #37 | Exceptional 11.8% |
| Russians | 99.3 /100 | #38 | Exceptional 11.8% |
| Immigrants | Poland | 99.3 /100 | #39 | Exceptional 11.8% |
| Macedonians | 99.3 /100 | #40 | Exceptional 11.8% |
| Czechs | 99.2 /100 | #41 | Exceptional 11.9% |
| Immigrants | Moldova | 99.2 /100 | #42 | Exceptional 11.9% |
| Koreans | 99.2 /100 | #43 | Exceptional 11.9% |
| Tongans | 99.2 /100 | #44 | Exceptional 11.9% |
| Immigrants | Czechoslovakia | 99.2 /100 | #45 | Exceptional 11.9% |
| Turks | 99.2 /100 | #46 | Exceptional 11.9% |
| Asians | 99.1 /100 | #47 | Exceptional 11.9% |
| Immigrants | Japan | 99.0 /100 | #48 | Exceptional 11.9% |
| Immigrants | Romania | 99.0 /100 | #49 | Exceptional 12.0% |
Demographics Similar to Mexicans by Female Poverty
In terms of female poverty, the demographic groups most similar to Mexicans are Somali (16.6%, a difference of 0.20%), Immigrants from Senegal (16.5%, a difference of 0.40%), Senegalese (16.5%, a difference of 0.42%), Immigrants from Cabo Verde (16.4%, a difference of 0.49%), and Immigrants from Latin America (16.4%, a difference of 0.53%).
| Demographics | Rating | Rank | Female Poverty |
| Immigrants | Bangladesh | 0.0 /100 | #290 | Tragic 16.4% |
| Yaqui | 0.0 /100 | #291 | Tragic 16.4% |
| Immigrants | Zaire | 0.0 /100 | #292 | Tragic 16.4% |
| Immigrants | Latin America | 0.0 /100 | #293 | Tragic 16.4% |
| Immigrants | Cabo Verde | 0.0 /100 | #294 | Tragic 16.4% |
| Senegalese | 0.0 /100 | #295 | Tragic 16.5% |
| Immigrants | Senegal | 0.0 /100 | #296 | Tragic 16.5% |
| Mexicans | 0.0 /100 | #297 | Tragic 16.5% |
| Somalis | 0.0 /100 | #298 | Tragic 16.6% |
| Hispanics or Latinos | 0.0 /100 | #299 | Tragic 16.6% |
| Bahamians | 0.0 /100 | #300 | Tragic 16.6% |
| Guatemalans | 0.0 /100 | #301 | Tragic 16.7% |
| Chippewa | 0.0 /100 | #302 | Tragic 16.7% |
| Choctaw | 0.0 /100 | #303 | Tragic 16.8% |
| Immigrants | Central America | 0.0 /100 | #304 | Tragic 16.8% |