Central American vs Mexican Female Poverty
COMPARE
Central American
Mexican
Female Poverty
Female Poverty Comparison
Central Americans
Mexicans
16.0%
FEMALE POVERTY
0.0/ 100
METRIC RATING
276th/ 347
METRIC RANK
16.5%
FEMALE POVERTY
0.0/ 100
METRIC RATING
297th/ 347
METRIC RANK
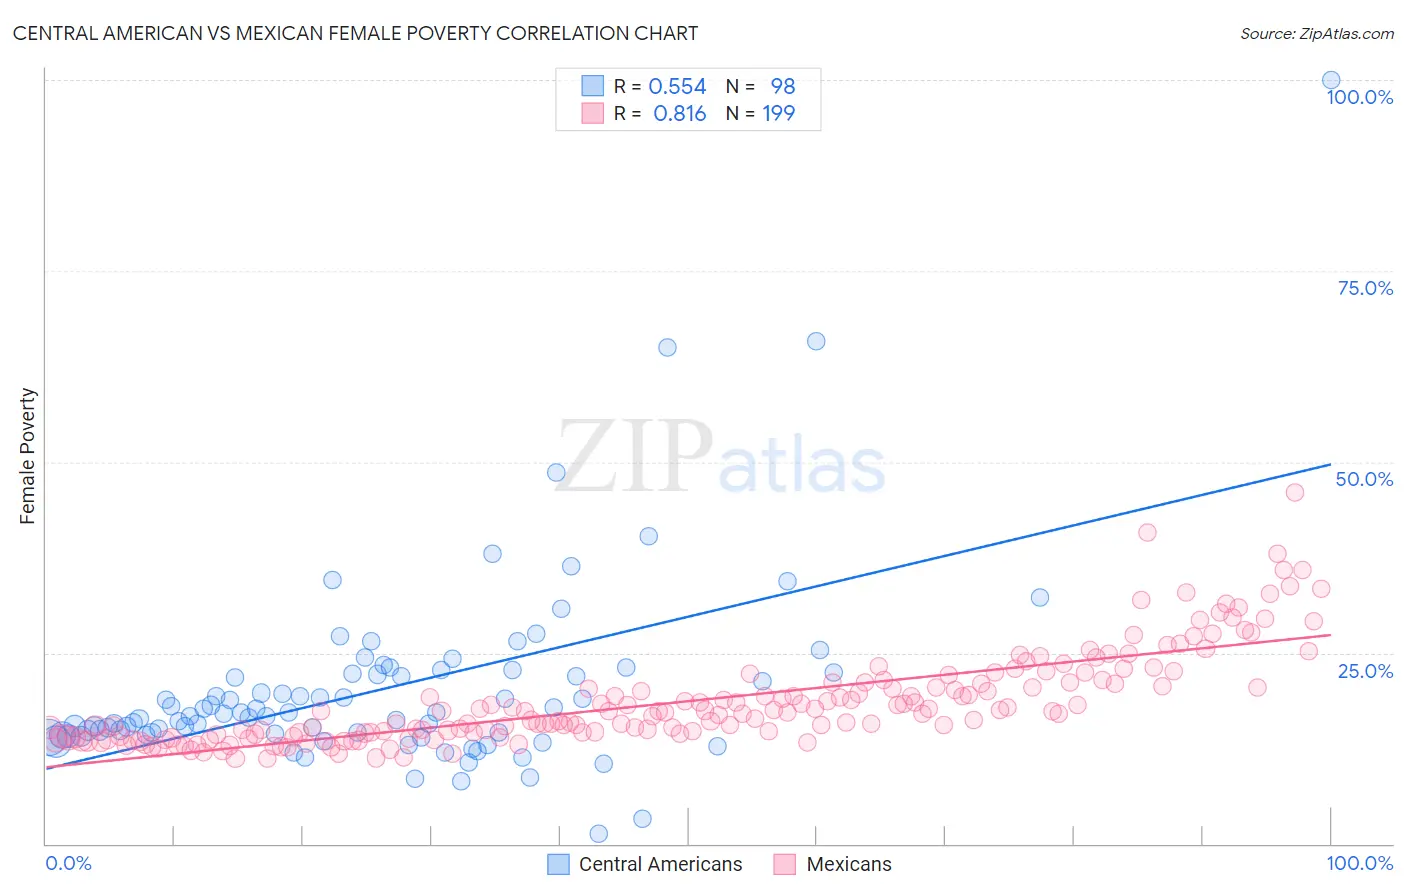
Central American vs Mexican Female Poverty Correlation Chart
The statistical analysis conducted on geographies consisting of 503,924,730 people shows a substantial positive correlation between the proportion of Central Americans and poverty level among females in the United States with a correlation coefficient (R) of 0.554 and weighted average of 16.0%. Similarly, the statistical analysis conducted on geographies consisting of 564,122,541 people shows a very strong positive correlation between the proportion of Mexicans and poverty level among females in the United States with a correlation coefficient (R) of 0.816 and weighted average of 16.5%, a difference of 3.4%.
Female Poverty Correlation Summary
| Measurement | Central American | Mexican |
| Minimum | 1.3% | 11.1% |
| Maximum | 100.0% | 46.1% |
| Range | 98.8% | 35.0% |
| Mean | 20.2% | 18.6% |
| Median | 16.9% | 17.2% |
| Interquartile 25% (IQ1) | 14.3% | 14.3% |
| Interquartile 75% (IQ3) | 22.2% | 20.9% |
| Interquartile Range (IQR) | 7.9% | 6.6% |
| Standard Deviation (Sample) | 12.8% | 6.1% |
| Standard Deviation (Population) | 12.8% | 6.1% |
Similar Demographics by Female Poverty
Demographics Similar to Central Americans by Female Poverty
In terms of female poverty, the demographic groups most similar to Central Americans are Immigrants from Barbados (16.0%, a difference of 0.13%), Barbadian (15.9%, a difference of 0.19%), Bangladeshi (16.0%, a difference of 0.19%), Belizean (15.9%, a difference of 0.20%), and Haitian (15.9%, a difference of 0.20%).
| Demographics | Rating | Rank | Female Poverty |
| Iroquois | 0.1 /100 | #269 | Tragic 15.8% |
| Chickasaw | 0.1 /100 | #270 | Tragic 15.9% |
| Immigrants | St. Vincent and the Grenadines | 0.0 /100 | #271 | Tragic 15.9% |
| Belizeans | 0.0 /100 | #272 | Tragic 15.9% |
| Haitians | 0.0 /100 | #273 | Tragic 15.9% |
| Barbadians | 0.0 /100 | #274 | Tragic 15.9% |
| Immigrants | Barbados | 0.0 /100 | #275 | Tragic 16.0% |
| Central Americans | 0.0 /100 | #276 | Tragic 16.0% |
| Bangladeshis | 0.0 /100 | #277 | Tragic 16.0% |
| Immigrants | West Indies | 0.0 /100 | #278 | Tragic 16.1% |
| Immigrants | Bahamas | 0.0 /100 | #279 | Tragic 16.1% |
| Vietnamese | 0.0 /100 | #280 | Tragic 16.1% |
| West Indians | 0.0 /100 | #281 | Tragic 16.1% |
| Immigrants | Haiti | 0.0 /100 | #282 | Tragic 16.1% |
| Immigrants | Cuba | 0.0 /100 | #283 | Tragic 16.1% |
Demographics Similar to Mexicans by Female Poverty
In terms of female poverty, the demographic groups most similar to Mexicans are Somali (16.6%, a difference of 0.20%), Immigrants from Senegal (16.5%, a difference of 0.40%), Senegalese (16.5%, a difference of 0.42%), Immigrants from Cabo Verde (16.4%, a difference of 0.49%), and Immigrants from Latin America (16.4%, a difference of 0.53%).
| Demographics | Rating | Rank | Female Poverty |
| Immigrants | Bangladesh | 0.0 /100 | #290 | Tragic 16.4% |
| Yaqui | 0.0 /100 | #291 | Tragic 16.4% |
| Immigrants | Zaire | 0.0 /100 | #292 | Tragic 16.4% |
| Immigrants | Latin America | 0.0 /100 | #293 | Tragic 16.4% |
| Immigrants | Cabo Verde | 0.0 /100 | #294 | Tragic 16.4% |
| Senegalese | 0.0 /100 | #295 | Tragic 16.5% |
| Immigrants | Senegal | 0.0 /100 | #296 | Tragic 16.5% |
| Mexicans | 0.0 /100 | #297 | Tragic 16.5% |
| Somalis | 0.0 /100 | #298 | Tragic 16.6% |
| Hispanics or Latinos | 0.0 /100 | #299 | Tragic 16.6% |
| Bahamians | 0.0 /100 | #300 | Tragic 16.6% |
| Guatemalans | 0.0 /100 | #301 | Tragic 16.7% |
| Chippewa | 0.0 /100 | #302 | Tragic 16.7% |
| Choctaw | 0.0 /100 | #303 | Tragic 16.8% |
| Immigrants | Central America | 0.0 /100 | #304 | Tragic 16.8% |