Blackfeet vs Mexican In Labor Force | Age 20-64
COMPARE
Blackfeet
Mexican
In Labor Force | Age 20-64
In Labor Force | Age 20-64 Comparison
Blackfeet
Mexicans
77.0%
IN LABOR FORCE | AGE 20-64
0.0/ 100
METRIC RATING
311th/ 347
METRIC RANK
77.2%
IN LABOR FORCE | AGE 20-64
0.0/ 100
METRIC RATING
305th/ 347
METRIC RANK
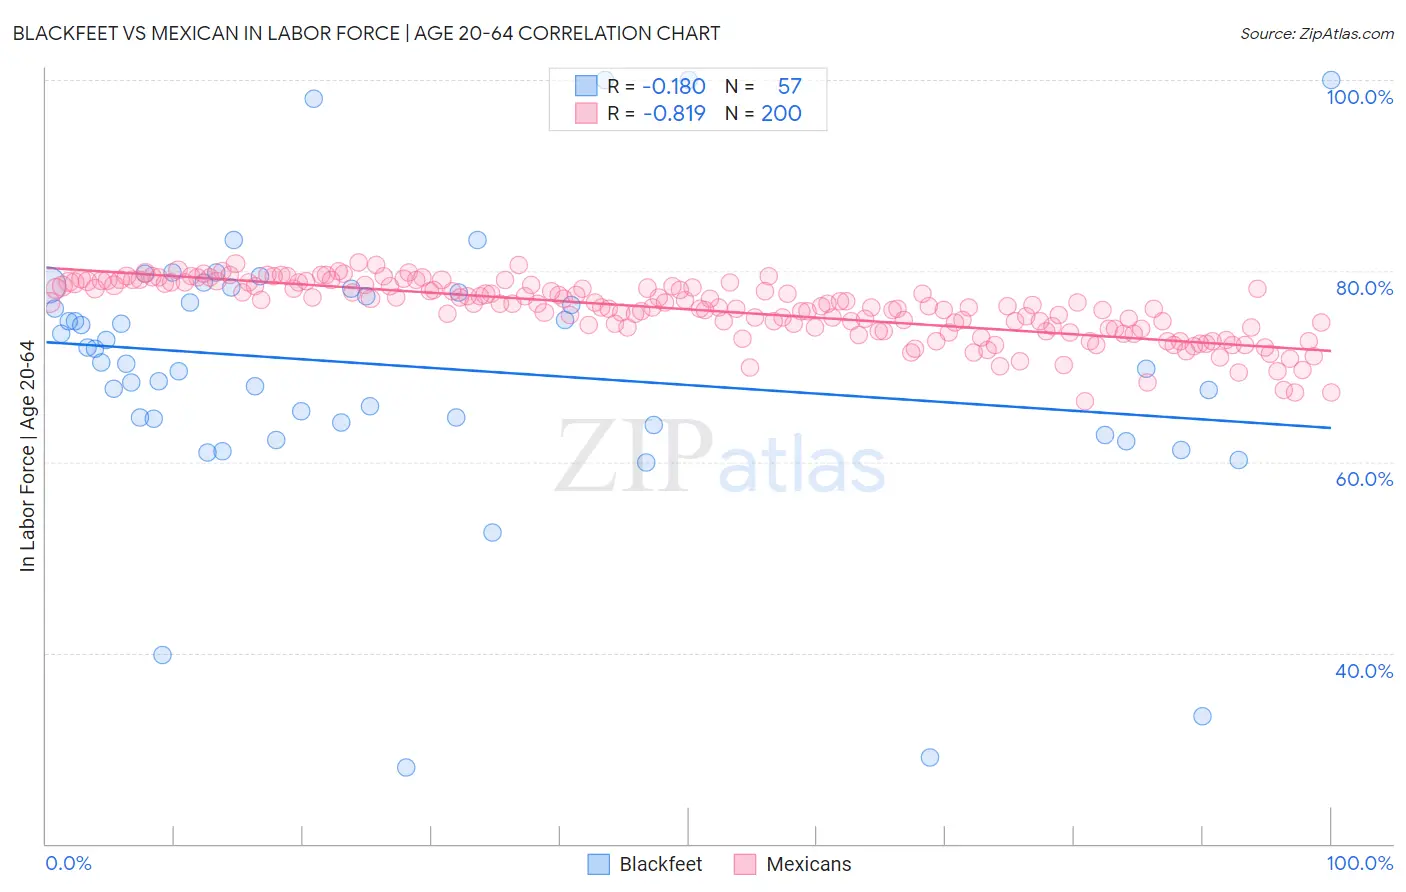
Blackfeet vs Mexican In Labor Force | Age 20-64 Correlation Chart
The statistical analysis conducted on geographies consisting of 309,562,637 people shows a poor negative correlation between the proportion of Blackfeet and labor force participation rate among population between the ages 20 and 64 in the United States with a correlation coefficient (R) of -0.180 and weighted average of 77.0%. Similarly, the statistical analysis conducted on geographies consisting of 565,322,836 people shows a very strong negative correlation between the proportion of Mexicans and labor force participation rate among population between the ages 20 and 64 in the United States with a correlation coefficient (R) of -0.819 and weighted average of 77.2%, a difference of 0.30%.
In Labor Force | Age 20-64 Correlation Summary
| Measurement | Blackfeet | Mexican |
| Minimum | 28.0% | 66.4% |
| Maximum | 100.0% | 80.9% |
| Range | 72.0% | 14.5% |
| Mean | 70.0% | 76.0% |
| Median | 70.4% | 76.5% |
| Interquartile 25% (IQ1) | 64.0% | 74.0% |
| Interquartile 75% (IQ3) | 77.9% | 78.6% |
| Interquartile Range (IQR) | 14.0% | 4.5% |
| Standard Deviation (Sample) | 14.5% | 3.1% |
| Standard Deviation (Population) | 14.3% | 3.1% |
Demographics Similar to Blackfeet and Mexicans by In Labor Force | Age 20-64
In terms of in labor force | age 20-64, the demographic groups most similar to Blackfeet are Comanche (77.0%, a difference of 0.030%), American (77.0%, a difference of 0.050%), Alaska Native (77.0%, a difference of 0.060%), Central American Indian (77.1%, a difference of 0.11%), and Alaskan Athabascan (76.9%, a difference of 0.17%). Similarly, the demographic groups most similar to Mexicans are Potawatomi (77.2%, a difference of 0.020%), Immigrants from Mexico (77.3%, a difference of 0.040%), Chippewa (77.3%, a difference of 0.11%), Central American Indian (77.1%, a difference of 0.19%), and Alaska Native (77.0%, a difference of 0.25%).
| Demographics | Rating | Rank | In Labor Force | Age 20-64 |
| Cree | 0.0 /100 | #298 | Tragic 77.7% |
| Hispanics or Latinos | 0.0 /100 | #299 | Tragic 77.6% |
| Spanish American Indians | 0.0 /100 | #300 | Tragic 77.6% |
| Nepalese | 0.0 /100 | #301 | Tragic 77.5% |
| Iroquois | 0.0 /100 | #302 | Tragic 77.5% |
| Chippewa | 0.0 /100 | #303 | Tragic 77.3% |
| Immigrants | Mexico | 0.0 /100 | #304 | Tragic 77.3% |
| Mexicans | 0.0 /100 | #305 | Tragic 77.2% |
| Potawatomi | 0.0 /100 | #306 | Tragic 77.2% |
| Central American Indians | 0.0 /100 | #307 | Tragic 77.1% |
| Alaska Natives | 0.0 /100 | #308 | Tragic 77.0% |
| Americans | 0.0 /100 | #309 | Tragic 77.0% |
| Comanche | 0.0 /100 | #310 | Tragic 77.0% |
| Blackfeet | 0.0 /100 | #311 | Tragic 77.0% |
| Alaskan Athabascans | 0.0 /100 | #312 | Tragic 76.9% |
| Shoshone | 0.0 /100 | #313 | Tragic 76.8% |
| Blacks/African Americans | 0.0 /100 | #314 | Tragic 76.8% |
| Ottawa | 0.0 /100 | #315 | Tragic 76.7% |
| Yaqui | 0.0 /100 | #316 | Tragic 76.5% |
| Cherokee | 0.0 /100 | #317 | Tragic 76.2% |
| Chickasaw | 0.0 /100 | #318 | Tragic 76.2% |