Bhutanese vs Tlingit-Haida Single Male Poverty
COMPARE
Bhutanese
Tlingit-Haida
Single Male Poverty
Single Male Poverty Comparison
Bhutanese
Tlingit-Haida
11.1%
SINGLE MALE POVERTY
100.0/ 100
METRIC RATING
16th/ 347
METRIC RANK
11.6%
SINGLE MALE POVERTY
99.9/ 100
METRIC RATING
49th/ 347
METRIC RANK
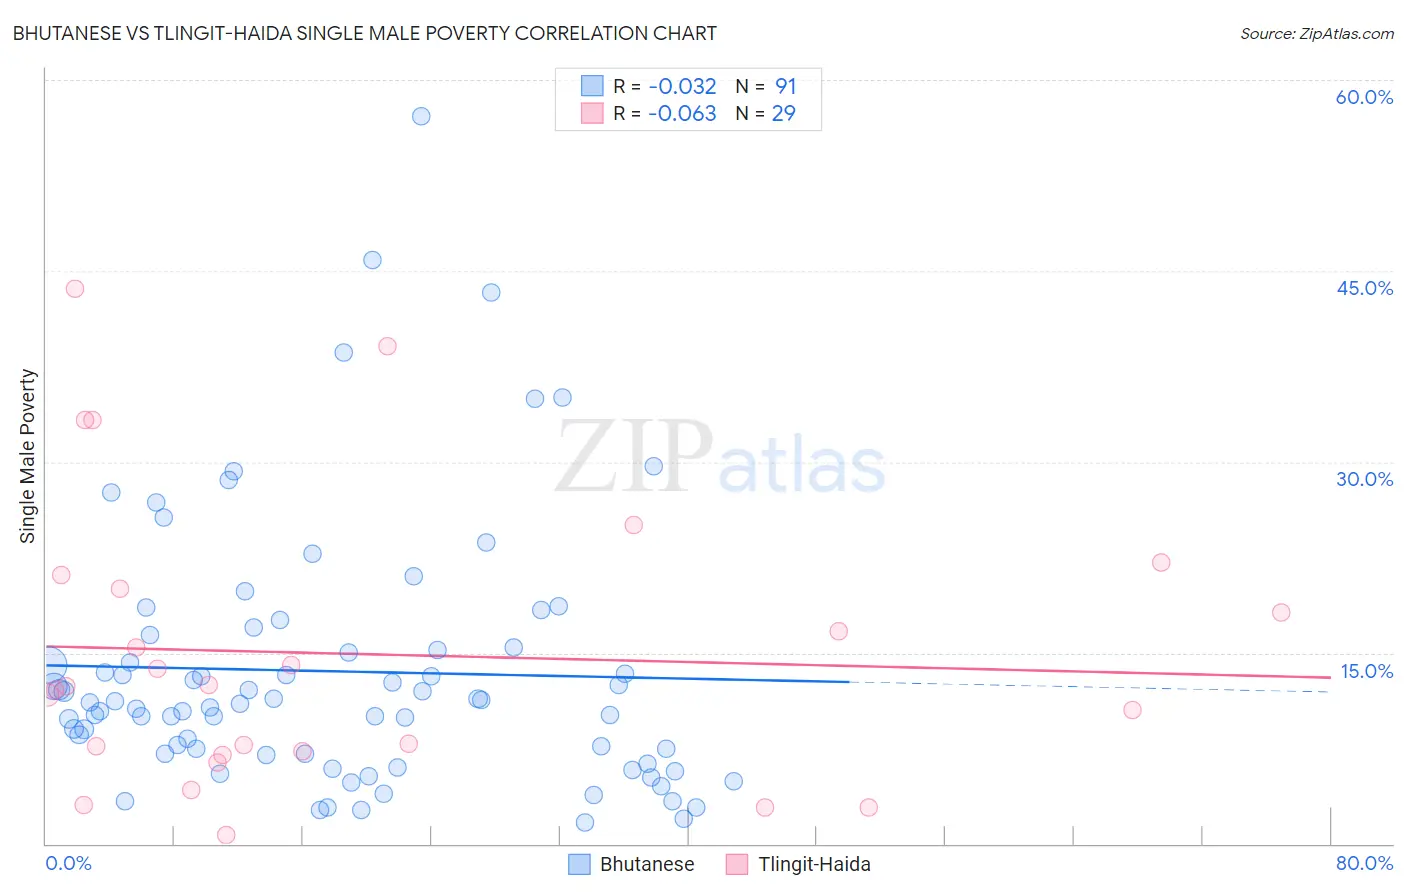
Bhutanese vs Tlingit-Haida Single Male Poverty Correlation Chart
The statistical analysis conducted on geographies consisting of 397,447,211 people shows no correlation between the proportion of Bhutanese and poverty level among single males in the United States with a correlation coefficient (R) of -0.032 and weighted average of 11.1%. Similarly, the statistical analysis conducted on geographies consisting of 58,517,751 people shows a slight negative correlation between the proportion of Tlingit-Haida and poverty level among single males in the United States with a correlation coefficient (R) of -0.063 and weighted average of 11.6%, a difference of 4.8%.
Single Male Poverty Correlation Summary
| Measurement | Bhutanese | Tlingit-Haida |
| Minimum | 1.6% | 0.66% |
| Maximum | 57.1% | 43.6% |
| Range | 55.5% | 43.0% |
| Mean | 13.5% | 14.9% |
| Median | 11.1% | 12.4% |
| Interquartile 25% (IQ1) | 7.1% | 7.1% |
| Interquartile 75% (IQ3) | 15.5% | 20.6% |
| Interquartile Range (IQR) | 8.4% | 13.5% |
| Standard Deviation (Sample) | 10.2% | 11.1% |
| Standard Deviation (Population) | 10.2% | 10.9% |
Similar Demographics by Single Male Poverty
Demographics Similar to Bhutanese by Single Male Poverty
In terms of single male poverty, the demographic groups most similar to Bhutanese are Tsimshian (11.1%, a difference of 0.090%), Immigrants from Bolivia (11.1%, a difference of 0.42%), Korean (11.0%, a difference of 0.75%), Chinese (11.0%, a difference of 0.81%), and Immigrants from Moldova (11.2%, a difference of 0.81%).
| Demographics | Rating | Rank | Single Male Poverty |
| Taiwanese | 100.0 /100 | #9 | Exceptional 10.9% |
| Immigrants | Fiji | 100.0 /100 | #10 | Exceptional 10.9% |
| Immigrants | Philippines | 100.0 /100 | #11 | Exceptional 10.9% |
| Immigrants | Afghanistan | 100.0 /100 | #12 | Exceptional 10.9% |
| Immigrants | South Central Asia | 100.0 /100 | #13 | Exceptional 10.9% |
| Chinese | 100.0 /100 | #14 | Exceptional 11.0% |
| Koreans | 100.0 /100 | #15 | Exceptional 11.0% |
| Bhutanese | 100.0 /100 | #16 | Exceptional 11.1% |
| Tsimshian | 100.0 /100 | #17 | Exceptional 11.1% |
| Immigrants | Bolivia | 100.0 /100 | #18 | Exceptional 11.1% |
| Immigrants | Moldova | 100.0 /100 | #19 | Exceptional 11.2% |
| Ethiopians | 100.0 /100 | #20 | Exceptional 11.2% |
| Asians | 100.0 /100 | #21 | Exceptional 11.2% |
| Immigrants | Pakistan | 100.0 /100 | #22 | Exceptional 11.2% |
| Bolivians | 100.0 /100 | #23 | Exceptional 11.2% |
Demographics Similar to Tlingit-Haida by Single Male Poverty
In terms of single male poverty, the demographic groups most similar to Tlingit-Haida are Immigrants from Indonesia (11.6%, a difference of 0.020%), Immigrants from Lithuania (11.6%, a difference of 0.060%), Nepalese (11.6%, a difference of 0.10%), Paraguayan (11.6%, a difference of 0.17%), and Immigrants from Bulgaria (11.6%, a difference of 0.29%).
| Demographics | Rating | Rank | Single Male Poverty |
| Egyptians | 99.9 /100 | #42 | Exceptional 11.5% |
| Immigrants | Peru | 99.9 /100 | #43 | Exceptional 11.5% |
| Immigrants | Cameroon | 99.9 /100 | #44 | Exceptional 11.5% |
| Immigrants | Poland | 99.9 /100 | #45 | Exceptional 11.5% |
| Immigrants | Bulgaria | 99.9 /100 | #46 | Exceptional 11.6% |
| Nepalese | 99.9 /100 | #47 | Exceptional 11.6% |
| Immigrants | Indonesia | 99.9 /100 | #48 | Exceptional 11.6% |
| Tlingit-Haida | 99.9 /100 | #49 | Exceptional 11.6% |
| Immigrants | Lithuania | 99.9 /100 | #50 | Exceptional 11.6% |
| Paraguayans | 99.9 /100 | #51 | Exceptional 11.6% |
| Samoans | 99.9 /100 | #52 | Exceptional 11.7% |
| Bulgarians | 99.9 /100 | #53 | Exceptional 11.7% |
| Immigrants | Uzbekistan | 99.9 /100 | #54 | Exceptional 11.7% |
| Cypriots | 99.9 /100 | #55 | Exceptional 11.7% |
| Burmese | 99.8 /100 | #56 | Exceptional 11.7% |