Belizean vs Immigrants from Cuba Receiving Food Stamps
COMPARE
Belizean
Immigrants from Cuba
Receiving Food Stamps
Receiving Food Stamps Comparison
Belizeans
Immigrants from Cuba
14.8%
RECEIVING FOOD STAMPS
0.1/ 100
METRIC RATING
278th/ 347
METRIC RANK
20.8%
RECEIVING FOOD STAMPS
0.0/ 100
METRIC RATING
335th/ 347
METRIC RANK
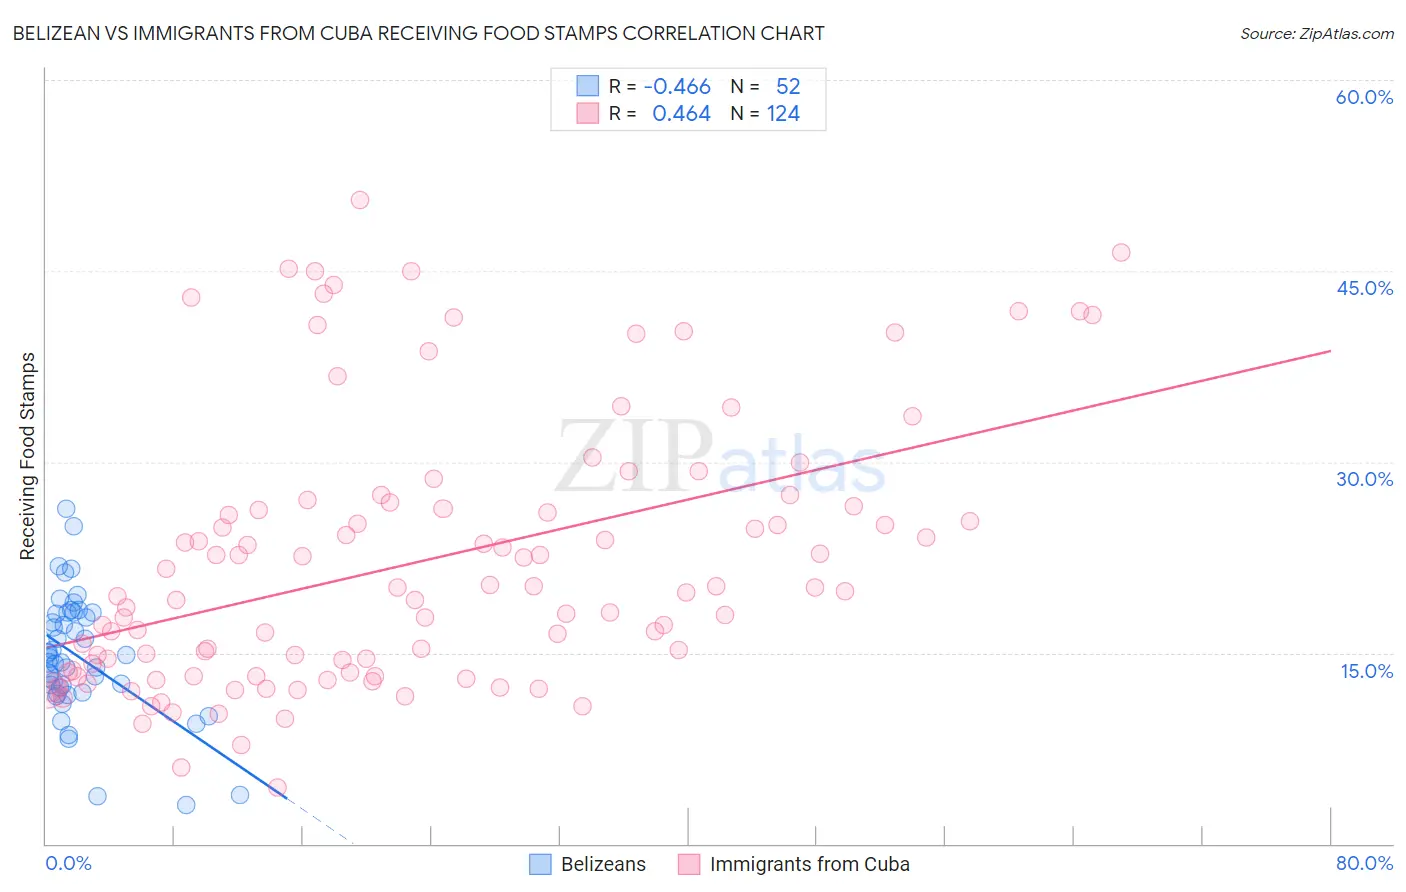
Belizean vs Immigrants from Cuba Receiving Food Stamps Correlation Chart
The statistical analysis conducted on geographies consisting of 144,020,862 people shows a moderate negative correlation between the proportion of Belizeans and percentage of population receiving government assistance and/or food stamps in the United States with a correlation coefficient (R) of -0.466 and weighted average of 14.8%. Similarly, the statistical analysis conducted on geographies consisting of 325,340,789 people shows a moderate positive correlation between the proportion of Immigrants from Cuba and percentage of population receiving government assistance and/or food stamps in the United States with a correlation coefficient (R) of 0.464 and weighted average of 20.8%, a difference of 40.4%.
Receiving Food Stamps Correlation Summary
| Measurement | Belizean | Immigrants from Cuba |
| Minimum | 3.0% | 4.5% |
| Maximum | 26.3% | 50.6% |
| Range | 23.3% | 46.1% |
| Mean | 14.7% | 22.1% |
| Median | 14.4% | 19.8% |
| Interquartile 25% (IQ1) | 12.1% | 13.5% |
| Interquartile 75% (IQ3) | 18.1% | 26.4% |
| Interquartile Range (IQR) | 6.0% | 12.9% |
| Standard Deviation (Sample) | 4.8% | 10.5% |
| Standard Deviation (Population) | 4.7% | 10.4% |
Similar Demographics by Receiving Food Stamps
Demographics Similar to Belizeans by Receiving Food Stamps
In terms of receiving food stamps, the demographic groups most similar to Belizeans are Seminole (14.8%, a difference of 0.13%), Liberian (14.8%, a difference of 0.18%), Kiowa (14.9%, a difference of 0.27%), Ecuadorian (14.9%, a difference of 0.32%), and Spanish American Indian (14.9%, a difference of 0.64%).
| Demographics | Rating | Rank | Receiving Food Stamps |
| Immigrants | Guatemala | 0.1 /100 | #271 | Tragic 14.6% |
| Chippewa | 0.1 /100 | #272 | Tragic 14.7% |
| Alaskan Athabascans | 0.1 /100 | #273 | Tragic 14.7% |
| Immigrants | Western Africa | 0.1 /100 | #274 | Tragic 14.7% |
| Ute | 0.1 /100 | #275 | Tragic 14.7% |
| Liberians | 0.1 /100 | #276 | Tragic 14.8% |
| Seminole | 0.1 /100 | #277 | Tragic 14.8% |
| Belizeans | 0.1 /100 | #278 | Tragic 14.8% |
| Kiowa | 0.0 /100 | #279 | Tragic 14.9% |
| Ecuadorians | 0.0 /100 | #280 | Tragic 14.9% |
| Spanish American Indians | 0.0 /100 | #281 | Tragic 14.9% |
| Immigrants | Central America | 0.0 /100 | #282 | Tragic 15.0% |
| Bangladeshis | 0.0 /100 | #283 | Tragic 15.0% |
| Immigrants | Ecuador | 0.0 /100 | #284 | Tragic 15.0% |
| Immigrants | Liberia | 0.0 /100 | #285 | Tragic 15.1% |
Demographics Similar to Immigrants from Cuba by Receiving Food Stamps
In terms of receiving food stamps, the demographic groups most similar to Immigrants from Cuba are Navajo (21.1%, a difference of 1.1%), Cape Verdean (21.1%, a difference of 1.2%), Dominican (21.4%, a difference of 2.6%), Yakama (21.4%, a difference of 2.9%), and Yuman (20.2%, a difference of 2.9%).
| Demographics | Rating | Rank | Receiving Food Stamps |
| Colville | 0.0 /100 | #328 | Tragic 18.3% |
| Immigrants | Dominica | 0.0 /100 | #329 | Tragic 18.4% |
| Pima | 0.0 /100 | #330 | Tragic 19.0% |
| Immigrants | Caribbean | 0.0 /100 | #331 | Tragic 19.6% |
| Pueblo | 0.0 /100 | #332 | Tragic 19.9% |
| Inupiat | 0.0 /100 | #333 | Tragic 20.1% |
| Yuman | 0.0 /100 | #334 | Tragic 20.2% |
| Immigrants | Cuba | 0.0 /100 | #335 | Tragic 20.8% |
| Navajo | 0.0 /100 | #336 | Tragic 21.1% |
| Cape Verdeans | 0.0 /100 | #337 | Tragic 21.1% |
| Dominicans | 0.0 /100 | #338 | Tragic 21.4% |
| Yakama | 0.0 /100 | #339 | Tragic 21.4% |
| Tohono O'odham | 0.0 /100 | #340 | Tragic 21.5% |
| Hopi | 0.0 /100 | #341 | Tragic 21.6% |
| Immigrants | Yemen | 0.0 /100 | #342 | Tragic 21.6% |