Belizean vs Immigrants from Afghanistan Male Poverty
COMPARE
Belizean
Immigrants from Afghanistan
Male Poverty
Male Poverty Comparison
Belizeans
Immigrants from Afghanistan
13.6%
MALE POVERTY
0.0/ 100
METRIC RATING
278th/ 347
METRIC RANK
11.4%
MALE POVERTY
33.3/ 100
METRIC RATING
185th/ 347
METRIC RANK
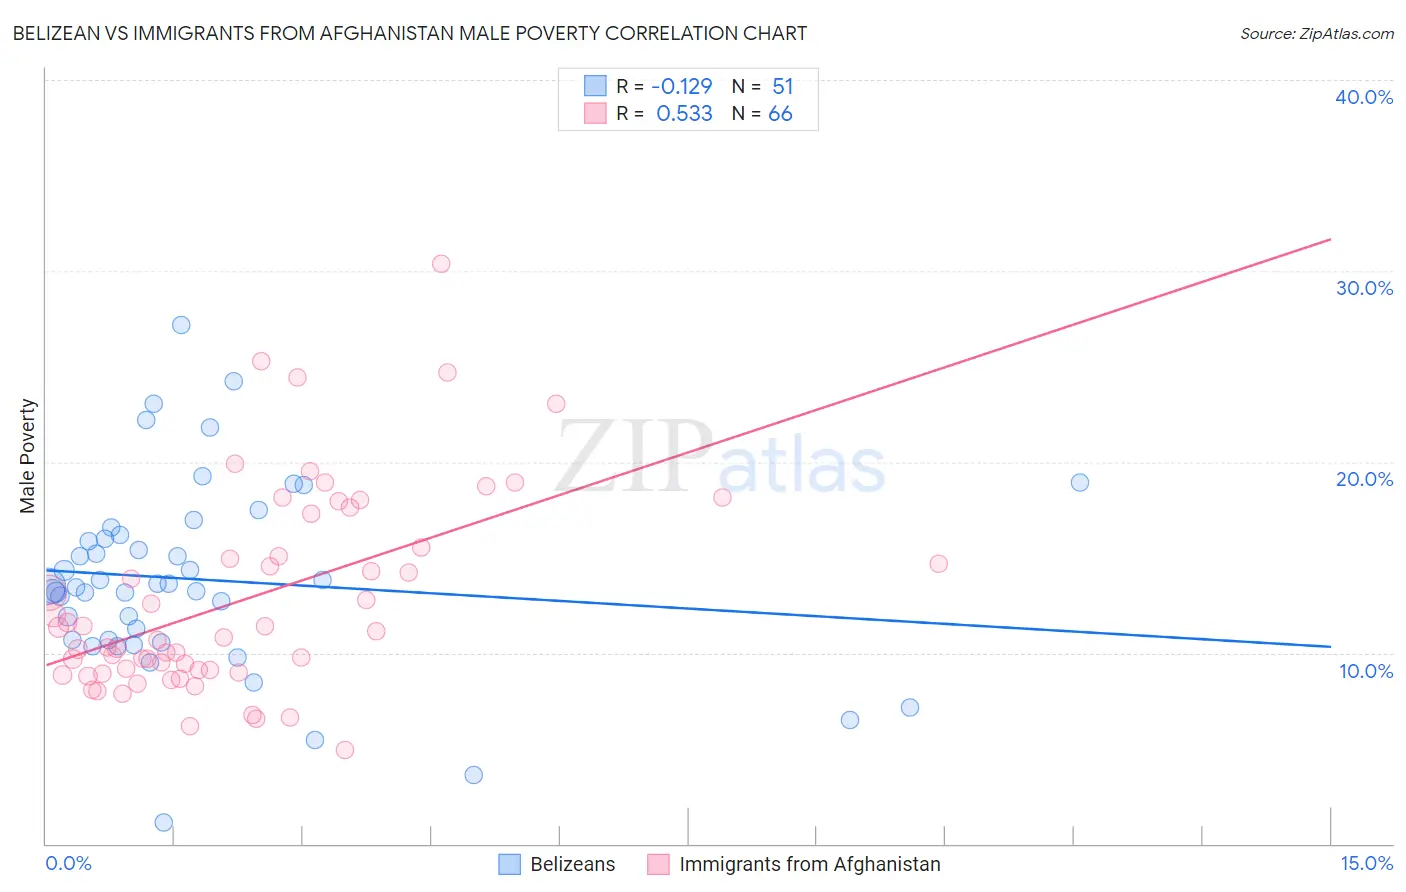
Belizean vs Immigrants from Afghanistan Male Poverty Correlation Chart
The statistical analysis conducted on geographies consisting of 144,147,961 people shows a poor negative correlation between the proportion of Belizeans and poverty level among males in the United States with a correlation coefficient (R) of -0.129 and weighted average of 13.6%. Similarly, the statistical analysis conducted on geographies consisting of 147,624,521 people shows a substantial positive correlation between the proportion of Immigrants from Afghanistan and poverty level among males in the United States with a correlation coefficient (R) of 0.533 and weighted average of 11.4%, a difference of 19.9%.
Male Poverty Correlation Summary
| Measurement | Belizean | Immigrants from Afghanistan |
| Minimum | 1.1% | 4.9% |
| Maximum | 27.1% | 30.4% |
| Range | 26.0% | 25.5% |
| Mean | 13.8% | 12.8% |
| Median | 13.5% | 11.0% |
| Interquartile 25% (IQ1) | 10.7% | 9.1% |
| Interquartile 75% (IQ3) | 16.2% | 15.5% |
| Interquartile Range (IQR) | 5.5% | 6.4% |
| Standard Deviation (Sample) | 5.0% | 5.3% |
| Standard Deviation (Population) | 4.9% | 5.3% |
Similar Demographics by Male Poverty
Demographics Similar to Belizeans by Male Poverty
In terms of male poverty, the demographic groups most similar to Belizeans are Bangladeshi (13.6%, a difference of 0.10%), Haitian (13.7%, a difference of 0.18%), Immigrants from Latin America (13.6%, a difference of 0.24%), Mexican (13.7%, a difference of 0.27%), and Yaqui (13.7%, a difference of 0.32%).
| Demographics | Rating | Rank | Male Poverty |
| Spanish Americans | 0.0 /100 | #271 | Tragic 13.4% |
| Immigrants | Bahamas | 0.0 /100 | #272 | Tragic 13.5% |
| Chickasaw | 0.0 /100 | #273 | Tragic 13.5% |
| Immigrants | West Indies | 0.0 /100 | #274 | Tragic 13.5% |
| Barbadians | 0.0 /100 | #275 | Tragic 13.6% |
| Immigrants | Latin America | 0.0 /100 | #276 | Tragic 13.6% |
| Bangladeshis | 0.0 /100 | #277 | Tragic 13.6% |
| Belizeans | 0.0 /100 | #278 | Tragic 13.6% |
| Haitians | 0.0 /100 | #279 | Tragic 13.7% |
| Mexicans | 0.0 /100 | #280 | Tragic 13.7% |
| Yaqui | 0.0 /100 | #281 | Tragic 13.7% |
| Immigrants | Cabo Verde | 0.0 /100 | #282 | Tragic 13.7% |
| Comanche | 0.0 /100 | #283 | Tragic 13.8% |
| Immigrants | Haiti | 0.0 /100 | #284 | Tragic 13.8% |
| West Indians | 0.0 /100 | #285 | Tragic 13.8% |
Demographics Similar to Immigrants from Afghanistan by Male Poverty
In terms of male poverty, the demographic groups most similar to Immigrants from Afghanistan are Immigrants from Sierra Leone (11.4%, a difference of 0.050%), Immigrants from Iraq (11.4%, a difference of 0.16%), Immigrants from South America (11.3%, a difference of 0.38%), Sierra Leonean (11.4%, a difference of 0.38%), and Kenyan (11.3%, a difference of 0.54%).
| Demographics | Rating | Rank | Male Poverty |
| Immigrants | Cameroon | 44.5 /100 | #178 | Average 11.2% |
| Immigrants | Syria | 40.3 /100 | #179 | Average 11.3% |
| Immigrants | Morocco | 40.1 /100 | #180 | Average 11.3% |
| Immigrants | Costa Rica | 39.5 /100 | #181 | Fair 11.3% |
| Mongolians | 39.0 /100 | #182 | Fair 11.3% |
| Kenyans | 38.4 /100 | #183 | Fair 11.3% |
| Immigrants | South America | 36.9 /100 | #184 | Fair 11.3% |
| Immigrants | Afghanistan | 33.3 /100 | #185 | Fair 11.4% |
| Immigrants | Sierra Leone | 32.9 /100 | #186 | Fair 11.4% |
| Immigrants | Iraq | 31.9 /100 | #187 | Fair 11.4% |
| Sierra Leoneans | 29.9 /100 | #188 | Fair 11.4% |
| Hawaiians | 28.3 /100 | #189 | Fair 11.4% |
| Israelis | 26.1 /100 | #190 | Fair 11.5% |
| South American Indians | 22.8 /100 | #191 | Fair 11.5% |
| Immigrants | Uruguay | 19.1 /100 | #192 | Poor 11.6% |