Belgian vs Subsaharan African Male Poverty
COMPARE
Belgian
Subsaharan African
Male Poverty
Male Poverty Comparison
Belgians
Sub-Saharan Africans
10.3%
MALE POVERTY
95.9/ 100
METRIC RATING
81st/ 347
METRIC RANK
13.3%
MALE POVERTY
0.1/ 100
METRIC RATING
268th/ 347
METRIC RANK
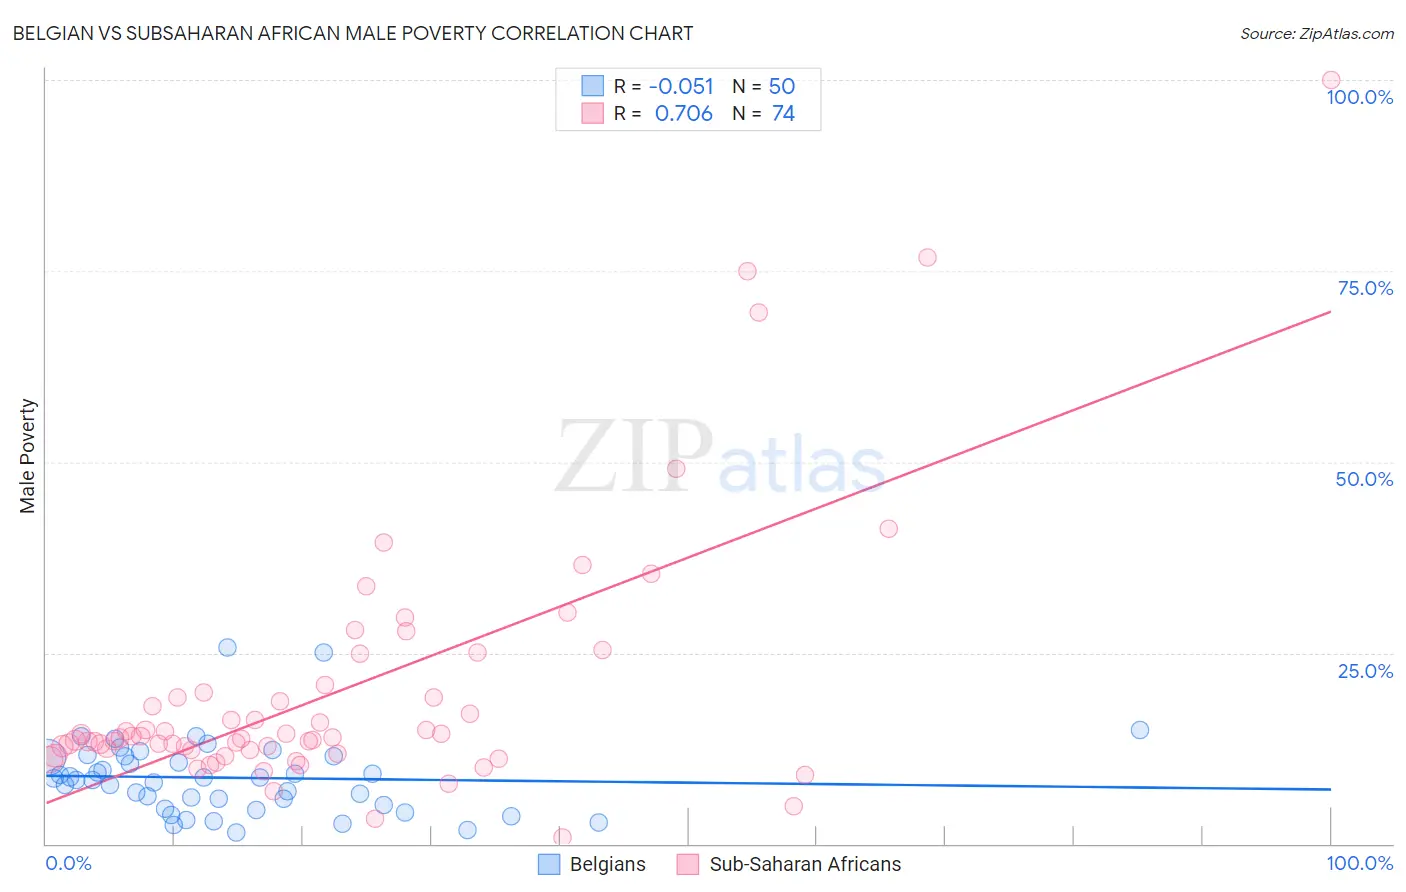
Belgian vs Subsaharan African Male Poverty Correlation Chart
The statistical analysis conducted on geographies consisting of 355,745,513 people shows a slight negative correlation between the proportion of Belgians and poverty level among males in the United States with a correlation coefficient (R) of -0.051 and weighted average of 10.3%. Similarly, the statistical analysis conducted on geographies consisting of 507,378,936 people shows a strong positive correlation between the proportion of Sub-Saharan Africans and poverty level among males in the United States with a correlation coefficient (R) of 0.706 and weighted average of 13.3%, a difference of 28.4%.
Male Poverty Correlation Summary
| Measurement | Belgian | Subsaharan African |
| Minimum | 1.4% | 0.81% |
| Maximum | 25.7% | 100.0% |
| Range | 24.3% | 99.2% |
| Mean | 8.6% | 20.0% |
| Median | 8.5% | 13.9% |
| Interquartile 25% (IQ1) | 5.1% | 12.3% |
| Interquartile 75% (IQ3) | 11.4% | 19.8% |
| Interquartile Range (IQR) | 6.4% | 7.6% |
| Standard Deviation (Sample) | 5.0% | 17.2% |
| Standard Deviation (Population) | 4.9% | 17.0% |
Similar Demographics by Male Poverty
Demographics Similar to Belgians by Male Poverty
In terms of male poverty, the demographic groups most similar to Belgians are Egyptian (10.3%, a difference of 0.0%), Immigrants from Sweden (10.3%, a difference of 0.13%), Czechoslovakian (10.3%, a difference of 0.19%), Immigrants from England (10.4%, a difference of 0.24%), and Immigrants from Eastern Asia (10.4%, a difference of 0.37%).
| Demographics | Rating | Rank | Male Poverty |
| Immigrants | Eastern Europe | 96.9 /100 | #74 | Exceptional 10.2% |
| Carpatho Rusyns | 96.9 /100 | #75 | Exceptional 10.2% |
| Dutch | 96.9 /100 | #76 | Exceptional 10.2% |
| Immigrants | Belgium | 96.8 /100 | #77 | Exceptional 10.3% |
| Irish | 96.8 /100 | #78 | Exceptional 10.3% |
| Immigrants | North America | 96.5 /100 | #79 | Exceptional 10.3% |
| English | 96.4 /100 | #80 | Exceptional 10.3% |
| Belgians | 95.9 /100 | #81 | Exceptional 10.3% |
| Egyptians | 95.9 /100 | #82 | Exceptional 10.3% |
| Immigrants | Sweden | 95.7 /100 | #83 | Exceptional 10.3% |
| Czechoslovakians | 95.6 /100 | #84 | Exceptional 10.3% |
| Immigrants | England | 95.5 /100 | #85 | Exceptional 10.4% |
| Immigrants | Eastern Asia | 95.3 /100 | #86 | Exceptional 10.4% |
| Northern Europeans | 95.2 /100 | #87 | Exceptional 10.4% |
| Cambodians | 95.0 /100 | #88 | Exceptional 10.4% |
Demographics Similar to Sub-Saharan Africans by Male Poverty
In terms of male poverty, the demographic groups most similar to Sub-Saharan Africans are Immigrants from Jamaica (13.3%, a difference of 0.030%), Immigrants from Guyana (13.2%, a difference of 0.14%), Guyanese (13.3%, a difference of 0.22%), Jamaican (13.2%, a difference of 0.28%), and Iroquois (13.2%, a difference of 0.30%).
| Demographics | Rating | Rank | Male Poverty |
| Trinidadians and Tobagonians | 0.1 /100 | #261 | Tragic 13.1% |
| Spanish American Indians | 0.1 /100 | #262 | Tragic 13.1% |
| Central Americans | 0.1 /100 | #263 | Tragic 13.2% |
| Iroquois | 0.1 /100 | #264 | Tragic 13.2% |
| Jamaicans | 0.1 /100 | #265 | Tragic 13.2% |
| Immigrants | Guyana | 0.1 /100 | #266 | Tragic 13.2% |
| Immigrants | Jamaica | 0.1 /100 | #267 | Tragic 13.3% |
| Sub-Saharan Africans | 0.1 /100 | #268 | Tragic 13.3% |
| Guyanese | 0.0 /100 | #269 | Tragic 13.3% |
| Cree | 0.0 /100 | #270 | Tragic 13.3% |
| Spanish Americans | 0.0 /100 | #271 | Tragic 13.4% |
| Immigrants | Bahamas | 0.0 /100 | #272 | Tragic 13.5% |
| Chickasaw | 0.0 /100 | #273 | Tragic 13.5% |
| Immigrants | West Indies | 0.0 /100 | #274 | Tragic 13.5% |
| Barbadians | 0.0 /100 | #275 | Tragic 13.6% |