Immigrants from England vs Mongolian Receiving Food Stamps
COMPARE
Immigrants from England
Mongolian
Receiving Food Stamps
Receiving Food Stamps Comparison
Immigrants from England
Mongolians
10.0%
RECEIVING FOOD STAMPS
98.6/ 100
METRIC RATING
81st/ 347
METRIC RANK
10.5%
RECEIVING FOOD STAMPS
95.8/ 100
METRIC RATING
112th/ 347
METRIC RANK
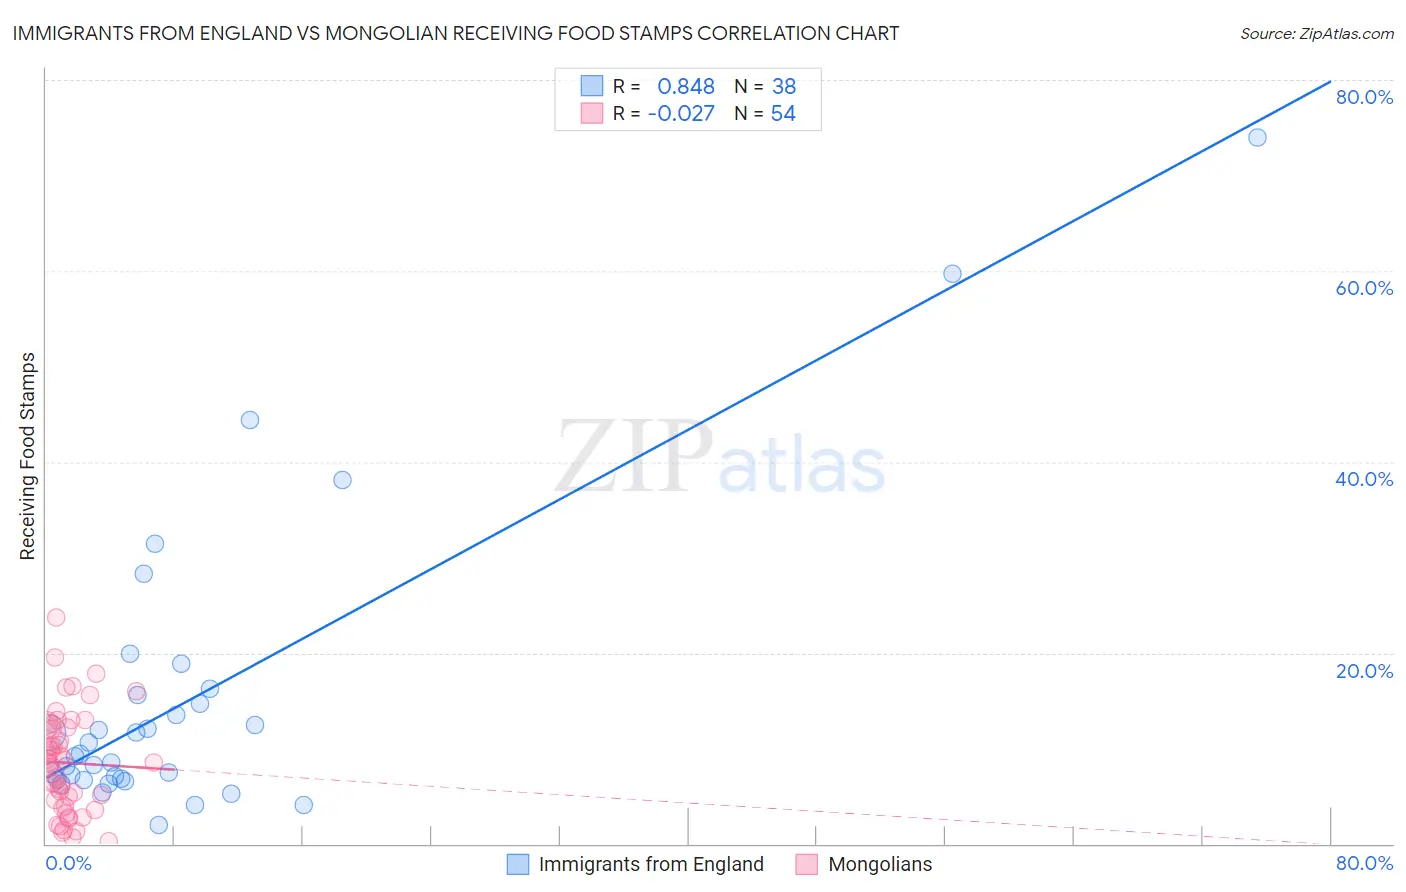
Immigrants from England vs Mongolian Receiving Food Stamps Correlation Chart
The statistical analysis conducted on geographies consisting of 390,689,765 people shows a very strong positive correlation between the proportion of Immigrants from England and percentage of population receiving government assistance and/or food stamps in the United States with a correlation coefficient (R) of 0.848 and weighted average of 10.0%. Similarly, the statistical analysis conducted on geographies consisting of 140,177,644 people shows no correlation between the proportion of Mongolians and percentage of population receiving government assistance and/or food stamps in the United States with a correlation coefficient (R) of -0.027 and weighted average of 10.5%, a difference of 4.6%.
Receiving Food Stamps Correlation Summary
| Measurement | Immigrants from England | Mongolian |
| Minimum | 2.0% | 0.30% |
| Maximum | 74.0% | 23.7% |
| Range | 72.0% | 23.4% |
| Mean | 15.2% | 8.5% |
| Median | 9.3% | 8.5% |
| Interquartile 25% (IQ1) | 6.7% | 4.0% |
| Interquartile 75% (IQ3) | 15.5% | 12.2% |
| Interquartile Range (IQR) | 8.9% | 8.2% |
| Standard Deviation (Sample) | 15.5% | 5.3% |
| Standard Deviation (Population) | 15.3% | 5.3% |
Similar Demographics by Receiving Food Stamps
Demographics Similar to Immigrants from England by Receiving Food Stamps
In terms of receiving food stamps, the demographic groups most similar to Immigrants from England are Austrian (10.0%, a difference of 0.13%), Dutch (10.0%, a difference of 0.13%), Polish (10.0%, a difference of 0.14%), Immigrants from Israel (10.0%, a difference of 0.20%), and Laotian (10.0%, a difference of 0.22%).
| Demographics | Rating | Rank | Receiving Food Stamps |
| New Zealanders | 98.8 /100 | #74 | Exceptional 9.9% |
| Immigrants | Zimbabwe | 98.7 /100 | #75 | Exceptional 9.9% |
| Immigrants | Croatia | 98.7 /100 | #76 | Exceptional 10.0% |
| Immigrants | North Macedonia | 98.7 /100 | #77 | Exceptional 10.0% |
| South Africans | 98.7 /100 | #78 | Exceptional 10.0% |
| Laotians | 98.7 /100 | #79 | Exceptional 10.0% |
| Poles | 98.6 /100 | #80 | Exceptional 10.0% |
| Immigrants | England | 98.6 /100 | #81 | Exceptional 10.0% |
| Austrians | 98.6 /100 | #82 | Exceptional 10.0% |
| Dutch | 98.6 /100 | #83 | Exceptional 10.0% |
| Immigrants | Israel | 98.5 /100 | #84 | Exceptional 10.0% |
| Immigrants | Romania | 98.5 /100 | #85 | Exceptional 10.0% |
| Immigrants | Norway | 98.4 /100 | #86 | Exceptional 10.0% |
| Egyptians | 98.4 /100 | #87 | Exceptional 10.0% |
| Immigrants | Kuwait | 98.4 /100 | #88 | Exceptional 10.0% |
Demographics Similar to Mongolians by Receiving Food Stamps
In terms of receiving food stamps, the demographic groups most similar to Mongolians are Romanian (10.4%, a difference of 0.010%), Pakistani (10.4%, a difference of 0.11%), Icelander (10.5%, a difference of 0.38%), Immigrants from Pakistan (10.4%, a difference of 0.39%), and Carpatho Rusyn (10.4%, a difference of 0.44%).
| Demographics | Rating | Rank | Receiving Food Stamps |
| Immigrants | Malaysia | 96.5 /100 | #105 | Exceptional 10.4% |
| Immigrants | Italy | 96.4 /100 | #106 | Exceptional 10.4% |
| Koreans | 96.3 /100 | #107 | Exceptional 10.4% |
| Carpatho Rusyns | 96.2 /100 | #108 | Exceptional 10.4% |
| Immigrants | Pakistan | 96.2 /100 | #109 | Exceptional 10.4% |
| Pakistanis | 95.9 /100 | #110 | Exceptional 10.4% |
| Romanians | 95.8 /100 | #111 | Exceptional 10.4% |
| Mongolians | 95.8 /100 | #112 | Exceptional 10.5% |
| Icelanders | 95.4 /100 | #113 | Exceptional 10.5% |
| Scotch-Irish | 95.1 /100 | #114 | Exceptional 10.5% |
| Immigrants | Saudi Arabia | 94.9 /100 | #115 | Exceptional 10.5% |
| Canadians | 94.8 /100 | #116 | Exceptional 10.5% |
| Immigrants | Nepal | 94.6 /100 | #117 | Exceptional 10.6% |
| Assyrians/Chaldeans/Syriacs | 94.1 /100 | #118 | Exceptional 10.6% |
| Immigrants | Poland | 93.9 /100 | #119 | Exceptional 10.6% |