Belgian vs Immigrants from Vietnam Seniors Poverty Over the Age of 65
COMPARE
Belgian
Immigrants from Vietnam
Seniors Poverty Over the Age of 65
Seniors Poverty Over the Age of 65 Comparison
Belgians
Immigrants from Vietnam
9.5%
SENIORS POVERTY OVER THE AGE OF 65
99.7/ 100
METRIC RATING
38th/ 347
METRIC RANK
11.2%
SENIORS POVERTY OVER THE AGE OF 65
26.6/ 100
METRIC RATING
195th/ 347
METRIC RANK
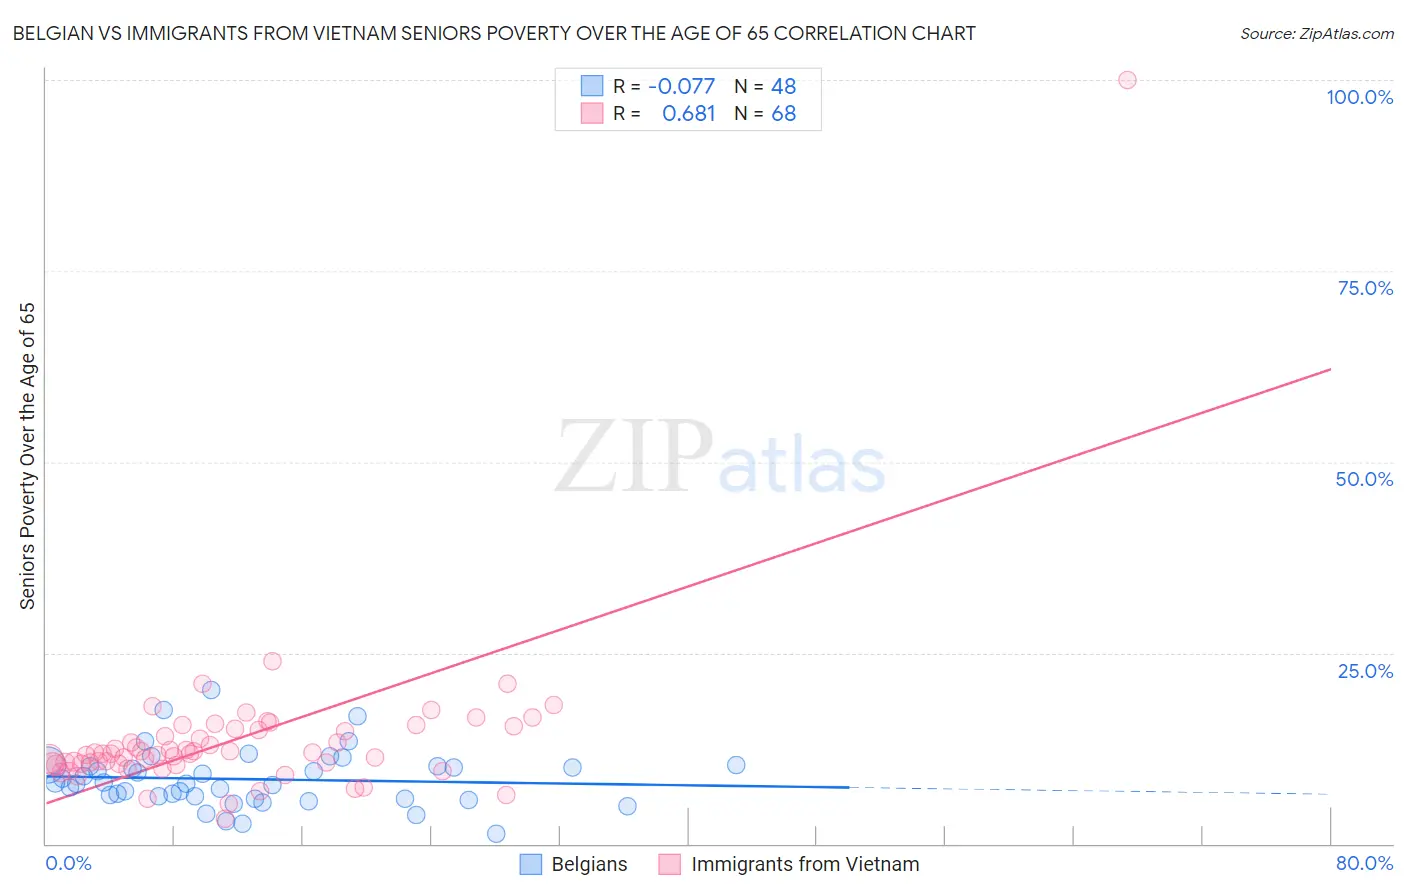
Belgian vs Immigrants from Vietnam Seniors Poverty Over the Age of 65 Correlation Chart
The statistical analysis conducted on geographies consisting of 354,885,444 people shows a slight negative correlation between the proportion of Belgians and poverty level among seniors over the age of 65 in the United States with a correlation coefficient (R) of -0.077 and weighted average of 9.5%. Similarly, the statistical analysis conducted on geographies consisting of 403,531,662 people shows a significant positive correlation between the proportion of Immigrants from Vietnam and poverty level among seniors over the age of 65 in the United States with a correlation coefficient (R) of 0.681 and weighted average of 11.2%, a difference of 17.6%.
Seniors Poverty Over the Age of 65 Correlation Summary
| Measurement | Belgian | Immigrants from Vietnam |
| Minimum | 1.3% | 3.2% |
| Maximum | 20.1% | 100.0% |
| Range | 18.8% | 96.8% |
| Mean | 8.4% | 13.6% |
| Median | 7.9% | 11.7% |
| Interquartile 25% (IQ1) | 6.1% | 10.4% |
| Interquartile 75% (IQ3) | 10.1% | 15.0% |
| Interquartile Range (IQR) | 4.0% | 4.6% |
| Standard Deviation (Sample) | 3.7% | 11.3% |
| Standard Deviation (Population) | 3.7% | 11.2% |
Similar Demographics by Seniors Poverty Over the Age of 65
Demographics Similar to Belgians by Seniors Poverty Over the Age of 65
In terms of seniors poverty over the age of 65, the demographic groups most similar to Belgians are Scotch-Irish (9.5%, a difference of 0.020%), Czechoslovakian (9.5%, a difference of 0.52%), Latvian (9.5%, a difference of 0.57%), Greek (9.6%, a difference of 0.63%), and Assyrian/Chaldean/Syriac (9.6%, a difference of 0.76%).
| Demographics | Rating | Rank | Seniors Poverty Over the Age of 65 |
| Finns | 99.8 /100 | #31 | Exceptional 9.4% |
| Northern Europeans | 99.8 /100 | #32 | Exceptional 9.4% |
| Native Hawaiians | 99.8 /100 | #33 | Exceptional 9.4% |
| British | 99.8 /100 | #34 | Exceptional 9.4% |
| Latvians | 99.8 /100 | #35 | Exceptional 9.5% |
| Czechoslovakians | 99.8 /100 | #36 | Exceptional 9.5% |
| Scotch-Irish | 99.7 /100 | #37 | Exceptional 9.5% |
| Belgians | 99.7 /100 | #38 | Exceptional 9.5% |
| Greeks | 99.6 /100 | #39 | Exceptional 9.6% |
| Assyrians/Chaldeans/Syriacs | 99.6 /100 | #40 | Exceptional 9.6% |
| Immigrants | North Macedonia | 99.6 /100 | #41 | Exceptional 9.6% |
| Zimbabweans | 99.6 /100 | #42 | Exceptional 9.6% |
| Eastern Europeans | 99.6 /100 | #43 | Exceptional 9.6% |
| Austrians | 99.5 /100 | #44 | Exceptional 9.6% |
| Estonians | 99.5 /100 | #45 | Exceptional 9.6% |
Demographics Similar to Immigrants from Vietnam by Seniors Poverty Over the Age of 65
In terms of seniors poverty over the age of 65, the demographic groups most similar to Immigrants from Vietnam are Chilean (11.2%, a difference of 0.13%), Bangladeshi (11.2%, a difference of 0.16%), Albanian (11.2%, a difference of 0.26%), Taiwanese (11.2%, a difference of 0.29%), and Immigrants from Southern Europe (11.1%, a difference of 0.37%).
| Demographics | Rating | Rank | Seniors Poverty Over the Age of 65 |
| Immigrants | Hong Kong | 36.3 /100 | #188 | Fair 11.1% |
| Immigrants | Laos | 35.7 /100 | #189 | Fair 11.1% |
| Indians (Asian) | 34.2 /100 | #190 | Fair 11.1% |
| Immigrants | Uganda | 32.2 /100 | #191 | Fair 11.1% |
| Immigrants | Southern Europe | 30.1 /100 | #192 | Fair 11.1% |
| Taiwanese | 29.2 /100 | #193 | Fair 11.2% |
| Chileans | 27.8 /100 | #194 | Fair 11.2% |
| Immigrants | Vietnam | 26.6 /100 | #195 | Fair 11.2% |
| Bangladeshis | 25.2 /100 | #196 | Fair 11.2% |
| Albanians | 24.4 /100 | #197 | Fair 11.2% |
| Immigrants | Burma/Myanmar | 21.3 /100 | #198 | Fair 11.3% |
| Immigrants | Israel | 20.3 /100 | #199 | Fair 11.3% |
| Alsatians | 20.1 /100 | #200 | Fair 11.3% |
| Immigrants | Brazil | 17.8 /100 | #201 | Poor 11.3% |
| Costa Ricans | 17.0 /100 | #202 | Poor 11.3% |