Belgian vs Mexican American Indian Seniors Poverty Over the Age of 65
COMPARE
Belgian
Mexican American Indian
Seniors Poverty Over the Age of 65
Seniors Poverty Over the Age of 65 Comparison
Belgians
Mexican American Indians
9.5%
SENIORS POVERTY OVER THE AGE OF 65
99.7/ 100
METRIC RATING
38th/ 347
METRIC RANK
12.4%
SENIORS POVERTY OVER THE AGE OF 65
0.3/ 100
METRIC RATING
255th/ 347
METRIC RANK
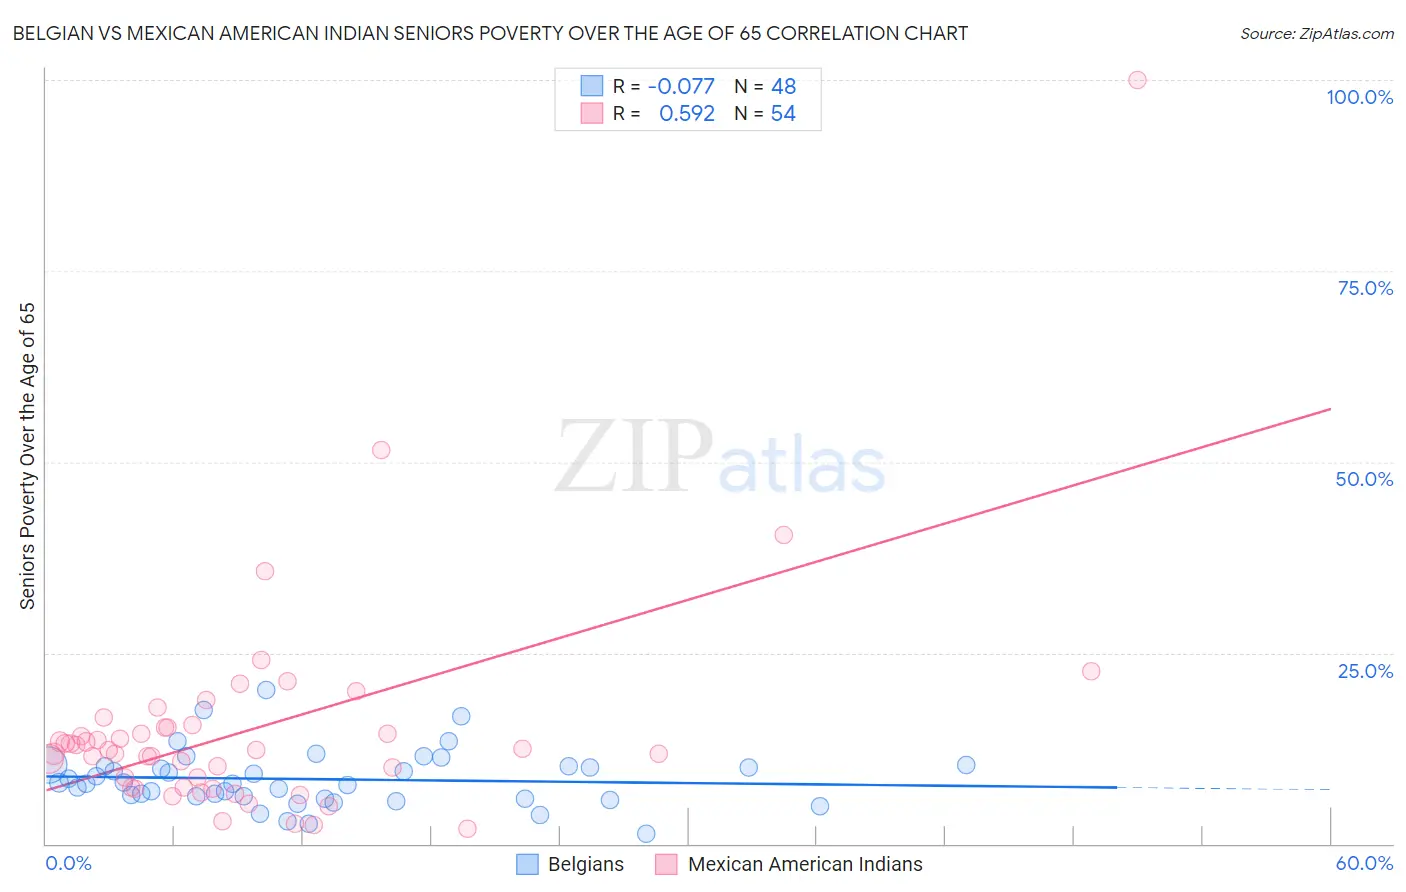
Belgian vs Mexican American Indian Seniors Poverty Over the Age of 65 Correlation Chart
The statistical analysis conducted on geographies consisting of 354,885,444 people shows a slight negative correlation between the proportion of Belgians and poverty level among seniors over the age of 65 in the United States with a correlation coefficient (R) of -0.077 and weighted average of 9.5%. Similarly, the statistical analysis conducted on geographies consisting of 316,752,558 people shows a substantial positive correlation between the proportion of Mexican American Indians and poverty level among seniors over the age of 65 in the United States with a correlation coefficient (R) of 0.592 and weighted average of 12.4%, a difference of 30.2%.
Seniors Poverty Over the Age of 65 Correlation Summary
| Measurement | Belgian | Mexican American Indian |
| Minimum | 1.3% | 2.0% |
| Maximum | 20.1% | 100.0% |
| Range | 18.8% | 98.0% |
| Mean | 8.4% | 15.1% |
| Median | 7.9% | 12.3% |
| Interquartile 25% (IQ1) | 6.1% | 7.4% |
| Interquartile 75% (IQ3) | 10.1% | 15.3% |
| Interquartile Range (IQR) | 4.0% | 7.8% |
| Standard Deviation (Sample) | 3.7% | 14.8% |
| Standard Deviation (Population) | 3.7% | 14.6% |
Similar Demographics by Seniors Poverty Over the Age of 65
Demographics Similar to Belgians by Seniors Poverty Over the Age of 65
In terms of seniors poverty over the age of 65, the demographic groups most similar to Belgians are Scotch-Irish (9.5%, a difference of 0.020%), Czechoslovakian (9.5%, a difference of 0.52%), Latvian (9.5%, a difference of 0.57%), Greek (9.6%, a difference of 0.63%), and Assyrian/Chaldean/Syriac (9.6%, a difference of 0.76%).
| Demographics | Rating | Rank | Seniors Poverty Over the Age of 65 |
| Finns | 99.8 /100 | #31 | Exceptional 9.4% |
| Northern Europeans | 99.8 /100 | #32 | Exceptional 9.4% |
| Native Hawaiians | 99.8 /100 | #33 | Exceptional 9.4% |
| British | 99.8 /100 | #34 | Exceptional 9.4% |
| Latvians | 99.8 /100 | #35 | Exceptional 9.5% |
| Czechoslovakians | 99.8 /100 | #36 | Exceptional 9.5% |
| Scotch-Irish | 99.7 /100 | #37 | Exceptional 9.5% |
| Belgians | 99.7 /100 | #38 | Exceptional 9.5% |
| Greeks | 99.6 /100 | #39 | Exceptional 9.6% |
| Assyrians/Chaldeans/Syriacs | 99.6 /100 | #40 | Exceptional 9.6% |
| Immigrants | North Macedonia | 99.6 /100 | #41 | Exceptional 9.6% |
| Zimbabweans | 99.6 /100 | #42 | Exceptional 9.6% |
| Eastern Europeans | 99.6 /100 | #43 | Exceptional 9.6% |
| Austrians | 99.5 /100 | #44 | Exceptional 9.6% |
| Estonians | 99.5 /100 | #45 | Exceptional 9.6% |
Demographics Similar to Mexican American Indians by Seniors Poverty Over the Age of 65
In terms of seniors poverty over the age of 65, the demographic groups most similar to Mexican American Indians are Immigrants from Cambodia (12.4%, a difference of 0.13%), Immigrants from Panama (12.4%, a difference of 0.23%), Immigrants (12.4%, a difference of 0.24%), Shoshone (12.3%, a difference of 0.34%), and Armenian (12.3%, a difference of 0.48%).
| Demographics | Rating | Rank | Seniors Poverty Over the Age of 65 |
| Spanish Americans | 0.6 /100 | #248 | Tragic 12.2% |
| Ute | 0.6 /100 | #249 | Tragic 12.2% |
| Immigrants | Liberia | 0.5 /100 | #250 | Tragic 12.2% |
| Somalis | 0.3 /100 | #251 | Tragic 12.3% |
| Armenians | 0.3 /100 | #252 | Tragic 12.3% |
| Shoshone | 0.3 /100 | #253 | Tragic 12.3% |
| Immigrants | Cambodia | 0.3 /100 | #254 | Tragic 12.4% |
| Mexican American Indians | 0.3 /100 | #255 | Tragic 12.4% |
| Immigrants | Panama | 0.2 /100 | #256 | Tragic 12.4% |
| Immigrants | Immigrants | 0.2 /100 | #257 | Tragic 12.4% |
| Dutch West Indians | 0.2 /100 | #258 | Tragic 12.4% |
| Ghanaians | 0.2 /100 | #259 | Tragic 12.4% |
| South Americans | 0.2 /100 | #260 | Tragic 12.5% |
| Colombians | 0.2 /100 | #261 | Tragic 12.5% |
| Venezuelans | 0.1 /100 | #262 | Tragic 12.5% |