Belgian vs Tohono O'odham Seniors Poverty Over the Age of 65
COMPARE
Belgian
Tohono O'odham
Seniors Poverty Over the Age of 65
Seniors Poverty Over the Age of 65 Comparison
Belgians
Tohono O'odham
9.5%
SENIORS POVERTY OVER THE AGE OF 65
99.7/ 100
METRIC RATING
38th/ 347
METRIC RANK
20.8%
SENIORS POVERTY OVER THE AGE OF 65
0.0/ 100
METRIC RATING
346th/ 347
METRIC RANK
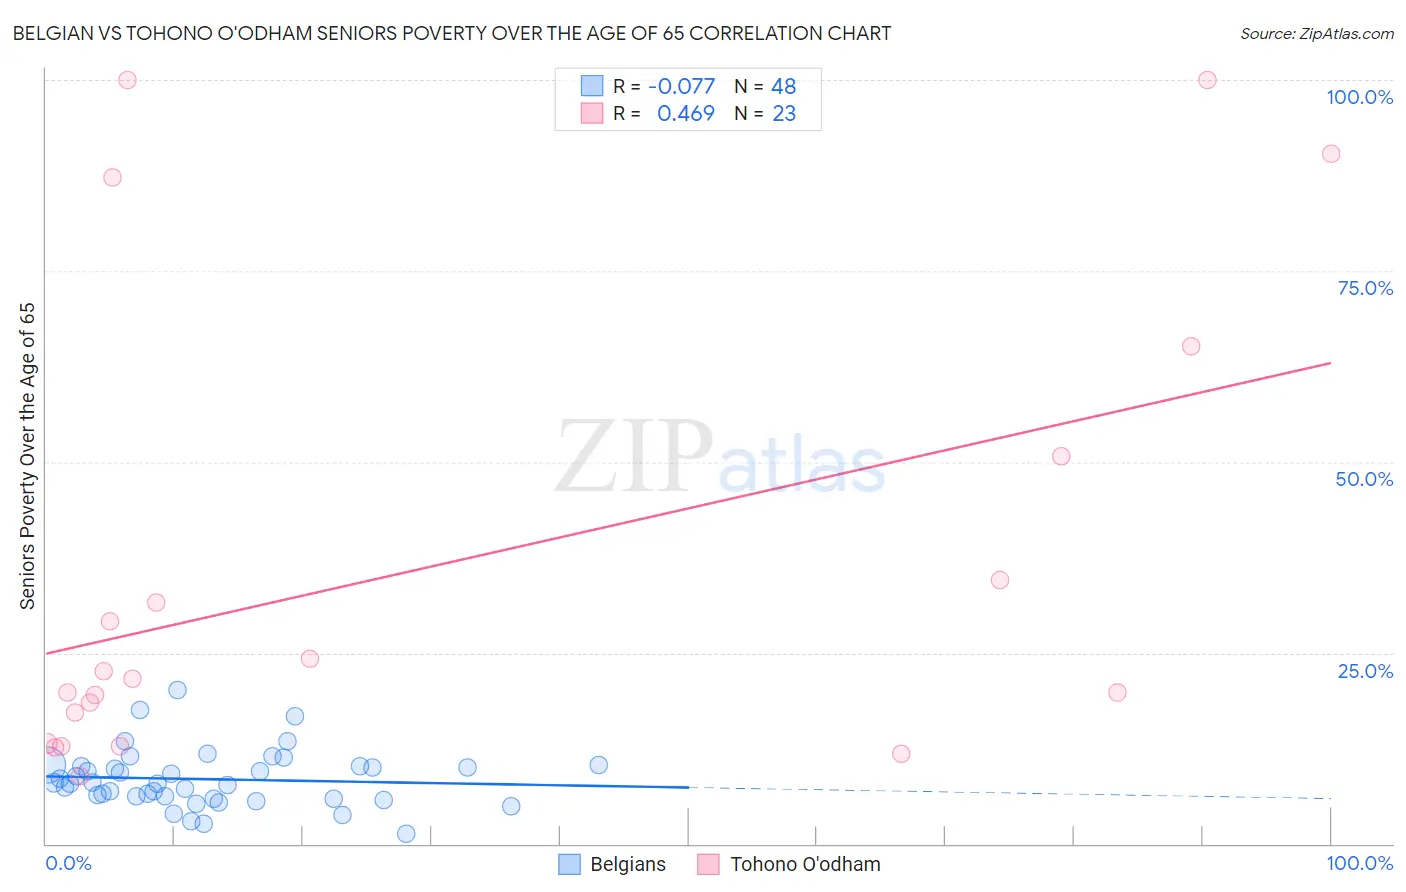
Belgian vs Tohono O'odham Seniors Poverty Over the Age of 65 Correlation Chart
The statistical analysis conducted on geographies consisting of 354,885,444 people shows a slight negative correlation between the proportion of Belgians and poverty level among seniors over the age of 65 in the United States with a correlation coefficient (R) of -0.077 and weighted average of 9.5%. Similarly, the statistical analysis conducted on geographies consisting of 58,655,684 people shows a moderate positive correlation between the proportion of Tohono O'odham and poverty level among seniors over the age of 65 in the United States with a correlation coefficient (R) of 0.469 and weighted average of 20.8%, a difference of 119.2%.
Seniors Poverty Over the Age of 65 Correlation Summary
| Measurement | Belgian | Tohono O'odham |
| Minimum | 1.3% | 8.8% |
| Maximum | 20.1% | 100.0% |
| Range | 18.8% | 91.2% |
| Mean | 8.4% | 35.8% |
| Median | 7.9% | 21.6% |
| Interquartile 25% (IQ1) | 6.1% | 13.2% |
| Interquartile 75% (IQ3) | 10.1% | 50.7% |
| Interquartile Range (IQR) | 4.0% | 37.6% |
| Standard Deviation (Sample) | 3.7% | 30.4% |
| Standard Deviation (Population) | 3.7% | 29.8% |
Similar Demographics by Seniors Poverty Over the Age of 65
Demographics Similar to Belgians by Seniors Poverty Over the Age of 65
In terms of seniors poverty over the age of 65, the demographic groups most similar to Belgians are Scotch-Irish (9.5%, a difference of 0.020%), Czechoslovakian (9.5%, a difference of 0.52%), Latvian (9.5%, a difference of 0.57%), Greek (9.6%, a difference of 0.63%), and Assyrian/Chaldean/Syriac (9.6%, a difference of 0.76%).
| Demographics | Rating | Rank | Seniors Poverty Over the Age of 65 |
| Finns | 99.8 /100 | #31 | Exceptional 9.4% |
| Northern Europeans | 99.8 /100 | #32 | Exceptional 9.4% |
| Native Hawaiians | 99.8 /100 | #33 | Exceptional 9.4% |
| British | 99.8 /100 | #34 | Exceptional 9.4% |
| Latvians | 99.8 /100 | #35 | Exceptional 9.5% |
| Czechoslovakians | 99.8 /100 | #36 | Exceptional 9.5% |
| Scotch-Irish | 99.7 /100 | #37 | Exceptional 9.5% |
| Belgians | 99.7 /100 | #38 | Exceptional 9.5% |
| Greeks | 99.6 /100 | #39 | Exceptional 9.6% |
| Assyrians/Chaldeans/Syriacs | 99.6 /100 | #40 | Exceptional 9.6% |
| Immigrants | North Macedonia | 99.6 /100 | #41 | Exceptional 9.6% |
| Zimbabweans | 99.6 /100 | #42 | Exceptional 9.6% |
| Eastern Europeans | 99.6 /100 | #43 | Exceptional 9.6% |
| Austrians | 99.5 /100 | #44 | Exceptional 9.6% |
| Estonians | 99.5 /100 | #45 | Exceptional 9.6% |
Demographics Similar to Tohono O'odham by Seniors Poverty Over the Age of 65
In terms of seniors poverty over the age of 65, the demographic groups most similar to Tohono O'odham are Puerto Rican (21.4%, a difference of 2.7%), Pima (19.8%, a difference of 5.2%), Immigrants from Dominican Republic (18.3%, a difference of 13.9%), Lumbee (18.1%, a difference of 14.9%), and Immigrants from Cuba (17.9%, a difference of 16.2%).
| Demographics | Rating | Rank | Seniors Poverty Over the Age of 65 |
| Immigrants | Yemen | 0.0 /100 | #333 | Tragic 15.9% |
| Immigrants | Nicaragua | 0.0 /100 | #334 | Tragic 15.9% |
| Cubans | 0.0 /100 | #335 | Tragic 16.1% |
| Immigrants | Cabo Verde | 0.0 /100 | #336 | Tragic 16.2% |
| Immigrants | Caribbean | 0.0 /100 | #337 | Tragic 16.5% |
| Pueblo | 0.0 /100 | #338 | Tragic 17.2% |
| Navajo | 0.0 /100 | #339 | Tragic 17.5% |
| Hopi | 0.0 /100 | #340 | Tragic 17.8% |
| Dominicans | 0.0 /100 | #341 | Tragic 17.8% |
| Immigrants | Cuba | 0.0 /100 | #342 | Tragic 17.9% |
| Lumbee | 0.0 /100 | #343 | Tragic 18.1% |
| Immigrants | Dominican Republic | 0.0 /100 | #344 | Tragic 18.3% |
| Pima | 0.0 /100 | #345 | Tragic 19.8% |
| Tohono O'odham | 0.0 /100 | #346 | Tragic 20.8% |
| Puerto Ricans | 0.0 /100 | #347 | Tragic 21.4% |