Belgian vs South American Seniors Poverty Over the Age of 65
COMPARE
Belgian
South American
Seniors Poverty Over the Age of 65
Seniors Poverty Over the Age of 65 Comparison
Belgians
South Americans
9.5%
SENIORS POVERTY OVER THE AGE OF 65
99.7/ 100
METRIC RATING
38th/ 347
METRIC RANK
12.5%
SENIORS POVERTY OVER THE AGE OF 65
0.2/ 100
METRIC RATING
260th/ 347
METRIC RANK
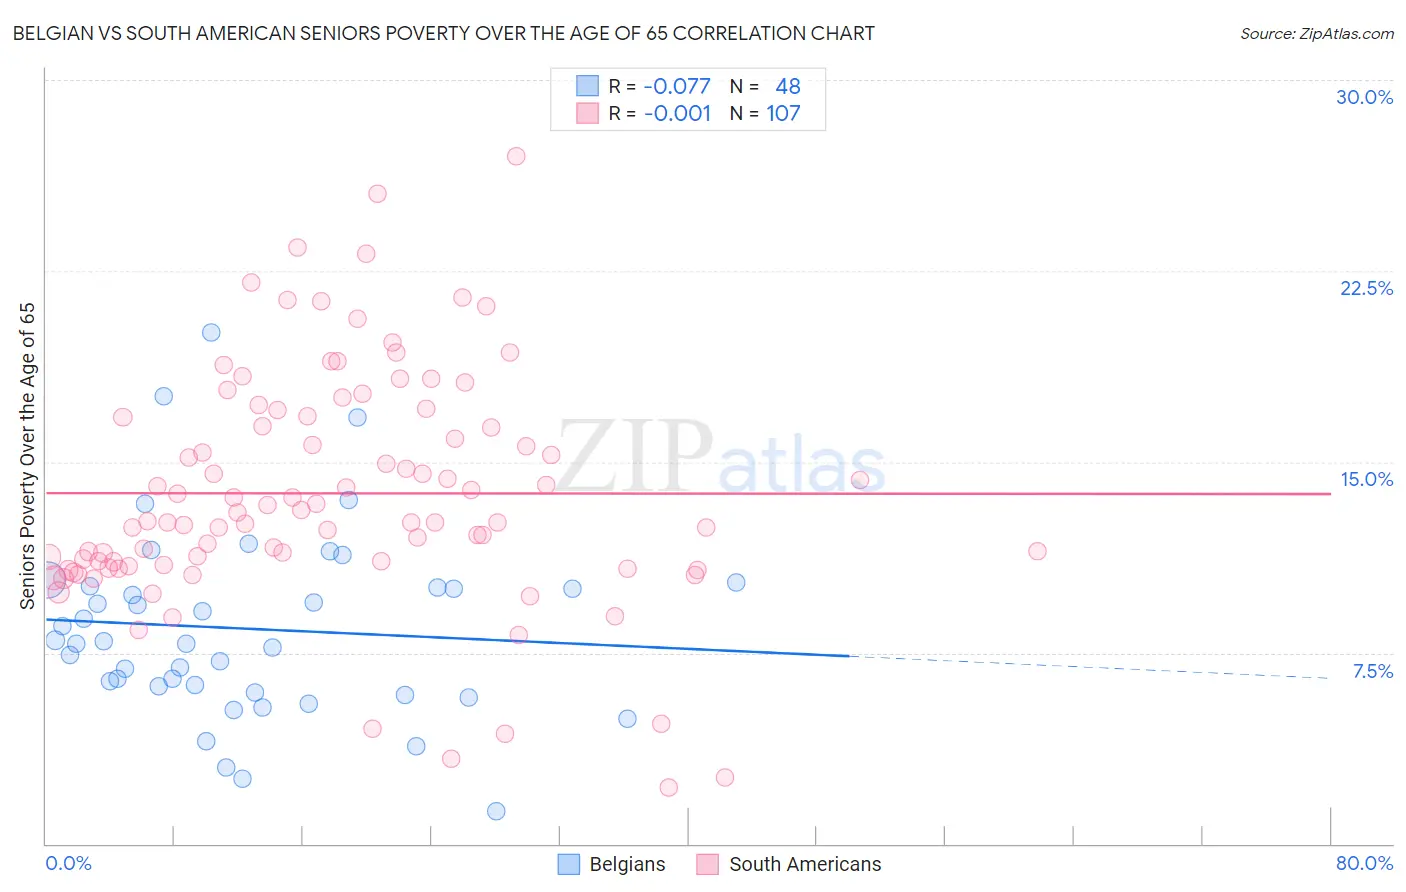
Belgian vs South American Seniors Poverty Over the Age of 65 Correlation Chart
The statistical analysis conducted on geographies consisting of 354,885,444 people shows a slight negative correlation between the proportion of Belgians and poverty level among seniors over the age of 65 in the United States with a correlation coefficient (R) of -0.077 and weighted average of 9.5%. Similarly, the statistical analysis conducted on geographies consisting of 491,284,753 people shows no correlation between the proportion of South Americans and poverty level among seniors over the age of 65 in the United States with a correlation coefficient (R) of -0.001 and weighted average of 12.5%, a difference of 31.2%.
Seniors Poverty Over the Age of 65 Correlation Summary
| Measurement | Belgian | South American |
| Minimum | 1.3% | 2.2% |
| Maximum | 20.1% | 27.0% |
| Range | 18.8% | 24.8% |
| Mean | 8.4% | 13.8% |
| Median | 7.9% | 12.7% |
| Interquartile 25% (IQ1) | 6.1% | 11.0% |
| Interquartile 75% (IQ3) | 10.1% | 16.8% |
| Interquartile Range (IQR) | 4.0% | 5.8% |
| Standard Deviation (Sample) | 3.7% | 4.6% |
| Standard Deviation (Population) | 3.7% | 4.6% |
Similar Demographics by Seniors Poverty Over the Age of 65
Demographics Similar to Belgians by Seniors Poverty Over the Age of 65
In terms of seniors poverty over the age of 65, the demographic groups most similar to Belgians are Scotch-Irish (9.5%, a difference of 0.020%), Czechoslovakian (9.5%, a difference of 0.52%), Latvian (9.5%, a difference of 0.57%), Greek (9.6%, a difference of 0.63%), and Assyrian/Chaldean/Syriac (9.6%, a difference of 0.76%).
| Demographics | Rating | Rank | Seniors Poverty Over the Age of 65 |
| Finns | 99.8 /100 | #31 | Exceptional 9.4% |
| Northern Europeans | 99.8 /100 | #32 | Exceptional 9.4% |
| Native Hawaiians | 99.8 /100 | #33 | Exceptional 9.4% |
| British | 99.8 /100 | #34 | Exceptional 9.4% |
| Latvians | 99.8 /100 | #35 | Exceptional 9.5% |
| Czechoslovakians | 99.8 /100 | #36 | Exceptional 9.5% |
| Scotch-Irish | 99.7 /100 | #37 | Exceptional 9.5% |
| Belgians | 99.7 /100 | #38 | Exceptional 9.5% |
| Greeks | 99.6 /100 | #39 | Exceptional 9.6% |
| Assyrians/Chaldeans/Syriacs | 99.6 /100 | #40 | Exceptional 9.6% |
| Immigrants | North Macedonia | 99.6 /100 | #41 | Exceptional 9.6% |
| Zimbabweans | 99.6 /100 | #42 | Exceptional 9.6% |
| Eastern Europeans | 99.6 /100 | #43 | Exceptional 9.6% |
| Austrians | 99.5 /100 | #44 | Exceptional 9.6% |
| Estonians | 99.5 /100 | #45 | Exceptional 9.6% |
Demographics Similar to South Americans by Seniors Poverty Over the Age of 65
In terms of seniors poverty over the age of 65, the demographic groups most similar to South Americans are Ghanaian (12.4%, a difference of 0.24%), Colombian (12.5%, a difference of 0.24%), Dutch West Indian (12.4%, a difference of 0.27%), Venezuelan (12.5%, a difference of 0.44%), and Immigrants (12.4%, a difference of 0.51%).
| Demographics | Rating | Rank | Seniors Poverty Over the Age of 65 |
| Shoshone | 0.3 /100 | #253 | Tragic 12.3% |
| Immigrants | Cambodia | 0.3 /100 | #254 | Tragic 12.4% |
| Mexican American Indians | 0.3 /100 | #255 | Tragic 12.4% |
| Immigrants | Panama | 0.2 /100 | #256 | Tragic 12.4% |
| Immigrants | Immigrants | 0.2 /100 | #257 | Tragic 12.4% |
| Dutch West Indians | 0.2 /100 | #258 | Tragic 12.4% |
| Ghanaians | 0.2 /100 | #259 | Tragic 12.4% |
| South Americans | 0.2 /100 | #260 | Tragic 12.5% |
| Colombians | 0.2 /100 | #261 | Tragic 12.5% |
| Venezuelans | 0.1 /100 | #262 | Tragic 12.5% |
| Soviet Union | 0.1 /100 | #263 | Tragic 12.6% |
| Inupiat | 0.1 /100 | #264 | Tragic 12.6% |
| Immigrants | Western Africa | 0.1 /100 | #265 | Tragic 12.6% |
| Africans | 0.1 /100 | #266 | Tragic 12.6% |
| Blackfeet | 0.1 /100 | #267 | Tragic 12.6% |