Barbadian vs Immigrants from Nicaragua 6th Grade
COMPARE
Barbadian
Immigrants from Nicaragua
6th Grade
6th Grade Comparison
Barbadians
Immigrants from Nicaragua
96.2%
6TH GRADE
0.0/ 100
METRIC RATING
286th/ 347
METRIC RANK
95.1%
6TH GRADE
0.0/ 100
METRIC RATING
325th/ 347
METRIC RANK
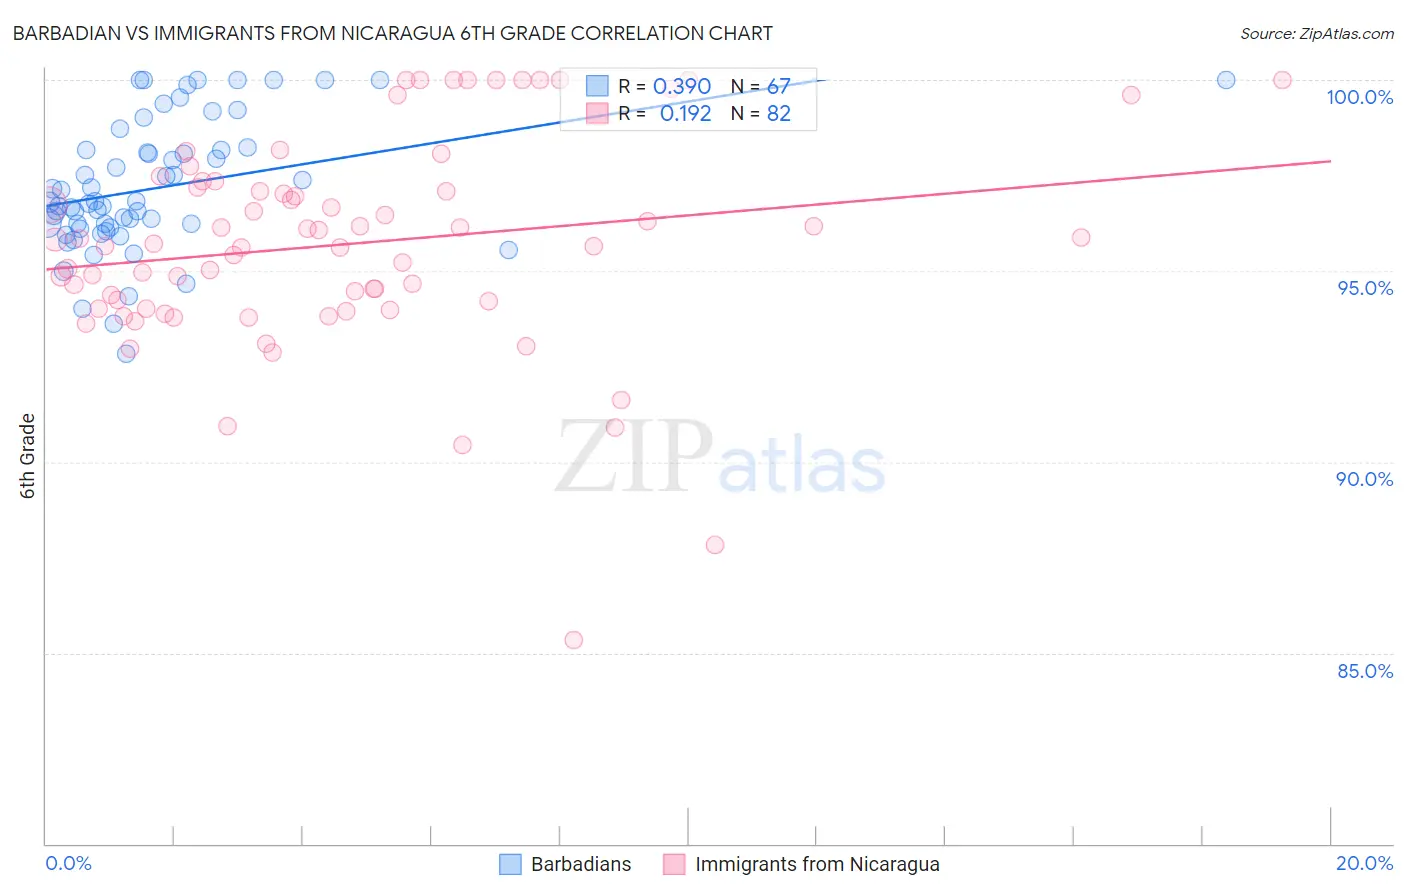
Barbadian vs Immigrants from Nicaragua 6th Grade Correlation Chart
The statistical analysis conducted on geographies consisting of 141,304,590 people shows a mild positive correlation between the proportion of Barbadians and percentage of population with at least 6th grade education in the United States with a correlation coefficient (R) of 0.390 and weighted average of 96.2%. Similarly, the statistical analysis conducted on geographies consisting of 236,341,411 people shows a poor positive correlation between the proportion of Immigrants from Nicaragua and percentage of population with at least 6th grade education in the United States with a correlation coefficient (R) of 0.192 and weighted average of 95.1%, a difference of 1.1%.
6th Grade Correlation Summary
| Measurement | Barbadian | Immigrants from Nicaragua |
| Minimum | 92.8% | 85.3% |
| Maximum | 100.0% | 100.0% |
| Range | 7.2% | 14.7% |
| Mean | 97.2% | 95.7% |
| Median | 96.8% | 95.7% |
| Interquartile 25% (IQ1) | 96.1% | 94.0% |
| Interquartile 75% (IQ3) | 98.2% | 97.2% |
| Interquartile Range (IQR) | 2.0% | 3.1% |
| Standard Deviation (Sample) | 1.7% | 2.8% |
| Standard Deviation (Population) | 1.7% | 2.8% |
Similar Demographics by 6th Grade
Demographics Similar to Barbadians by 6th Grade
In terms of 6th grade, the demographic groups most similar to Barbadians are Immigrants from Trinidad and Tobago (96.2%, a difference of 0.010%), Malaysian (96.2%, a difference of 0.020%), Somali (96.2%, a difference of 0.030%), Fijian (96.2%, a difference of 0.040%), and Immigrants from Eritrea (96.1%, a difference of 0.040%).
| Demographics | Rating | Rank | 6th Grade |
| Immigrants | Peru | 0.1 /100 | #279 | Tragic 96.2% |
| Immigrants | Afghanistan | 0.1 /100 | #280 | Tragic 96.2% |
| Trinidadians and Tobagonians | 0.1 /100 | #281 | Tragic 96.2% |
| Houma | 0.1 /100 | #282 | Tragic 96.2% |
| Cubans | 0.1 /100 | #283 | Tragic 96.2% |
| Fijians | 0.1 /100 | #284 | Tragic 96.2% |
| Somalis | 0.1 /100 | #285 | Tragic 96.2% |
| Barbadians | 0.0 /100 | #286 | Tragic 96.2% |
| Immigrants | Trinidad and Tobago | 0.0 /100 | #287 | Tragic 96.2% |
| Malaysians | 0.0 /100 | #288 | Tragic 96.2% |
| Immigrants | Eritrea | 0.0 /100 | #289 | Tragic 96.1% |
| Immigrants | Somalia | 0.0 /100 | #290 | Tragic 96.1% |
| Immigrants | St. Vincent and the Grenadines | 0.0 /100 | #291 | Tragic 96.1% |
| Immigrants | Barbados | 0.0 /100 | #292 | Tragic 96.1% |
| Immigrants | West Indies | 0.0 /100 | #293 | Tragic 96.1% |
Demographics Similar to Immigrants from Nicaragua by 6th Grade
In terms of 6th grade, the demographic groups most similar to Immigrants from Nicaragua are Cape Verdean (95.1%, a difference of 0.030%), Central American Indian (95.1%, a difference of 0.060%), Immigrants from Cambodia (95.2%, a difference of 0.070%), Hispanic or Latino (95.0%, a difference of 0.070%), and Mexican American Indian (95.0%, a difference of 0.10%).
| Demographics | Rating | Rank | 6th Grade |
| Belizeans | 0.0 /100 | #318 | Tragic 95.3% |
| Immigrants | Belize | 0.0 /100 | #319 | Tragic 95.3% |
| Immigrants | Ecuador | 0.0 /100 | #320 | Tragic 95.3% |
| Immigrants | Fiji | 0.0 /100 | #321 | Tragic 95.2% |
| Immigrants | Cambodia | 0.0 /100 | #322 | Tragic 95.2% |
| Central American Indians | 0.0 /100 | #323 | Tragic 95.1% |
| Cape Verdeans | 0.0 /100 | #324 | Tragic 95.1% |
| Immigrants | Nicaragua | 0.0 /100 | #325 | Tragic 95.1% |
| Hispanics or Latinos | 0.0 /100 | #326 | Tragic 95.0% |
| Mexican American Indians | 0.0 /100 | #327 | Tragic 95.0% |
| Hondurans | 0.0 /100 | #328 | Tragic 95.0% |
| Dominicans | 0.0 /100 | #329 | Tragic 94.9% |
| Nepalese | 0.0 /100 | #330 | Tragic 94.9% |
| Immigrants | Armenia | 0.0 /100 | #331 | Tragic 94.9% |
| Immigrants | Honduras | 0.0 /100 | #332 | Tragic 94.8% |