Barbadian vs Immigrants from Nicaragua Unemployment Among Women with Children Under 18 years

COMPARE

Barbadian
Race
Ancestry
AfghanAfricanAlaska NativeAlaskan AthabascanAlbanianAleutAlsatianAmericanApacheArabArapahoArgentineanArmenianAssyrian/Chaldean/SyriacAustralianAustrianBahamianBangladeshiBarbadianBasqueBelgianBelizeanBermudanBhutaneseBlackfeetBolivianBrazilianBritishBritish West IndianBulgarianBurmeseCajunCambodianCanadianCape VerdeanCarpatho RusynCelticCentral AmericanCentral American IndianCherokeeCheyenneChickasawChileanChineseChippewaChoctawColombianColvilleComancheCosta RicanCreeCreekCroatianCrowCubanCypriotCzechCzechoslovakianDanishDelawareDominicanDutchDutch West IndianEastern EuropeanEcuadorianEgyptianEnglishEstonianEthiopianEuropeanFijianFilipinoFinnishFrenchFrench American IndianFrench CanadianGermanGerman RussianGhanaianGreekGuamanian/ChamorroGuatemalanGuyaneseHaitianHmongHonduranHopiHoumaHungarianIcelanderIndian (Asian)IndonesianInupiatIranianIraqiIrishIroquoisIsraeliItalianJamaicanJapaneseJordanianKenyanKiowaKoreanLaotianLatvianLebaneseLiberianLithuanianLumbeeLuxembourgerMacedonianMalaysianMalteseMarshalleseMenomineeMexicanMexican American IndianMongolianMoroccanNative HawaiianNavajoNepaleseNew ZealanderNicaraguanNigerianNorthern EuropeanNorwegianOkinawanOsageOttawaPaiutePakistaniPalestinianPanamanianParaguayanPennsylvania GermanPeruvianPimaPolishPortuguesePotawatomiPuebloPuerto RicanPuget Sound SalishRomanianRussianSalvadoranSamoanScandinavianScotch-IrishScottishSeminoleSenegaleseSerbianShoshoneSierra LeoneanSiouxSlavicSlovakSloveneSomaliSouth AfricanSouth AmericanSouth American IndianSoviet UnionSpaniardSpanishSpanish AmericanSpanish American IndianSri LankanSubsaharan AfricanSudaneseSwedishSwissSyrianTaiwaneseThaiTlingit-HaidaTohono O'OdhamTonganTrinidadian and TobagonianTsimshianTurkishU.S. Virgin IslanderUgandanUkrainianUruguayanUteVenezuelanVietnameseWelshWest IndianYakamaYaquiYugoslavianYumanYup'ikZimbabwean
Immigration
NonimmigrantsImmigrantsAfghanistanAfricaAlbaniaArgentinaArmeniaAsiaAustraliaAustriaBahamasBangladeshBarbadosBelarusBelgiumBelizeBoliviaBosnia and HerzegovinaBrazilBulgariaBurma/MyanmarCabo VerdeCambodiaCameroonCanadaCaribbeanCentral AmericaChileChinaColombiaCongoCosta RicaCroatiaCubaCzechoslovakiaDenmarkDominicaDominican RepublicEastern AfricaEastern AsiaEastern EuropeEcuadorEgyptEl SalvadorEnglandEritreaEthiopiaEuropeFijiFranceGermanyGhanaGreeceGrenadaGuatemalaGuyanaHaitiHondurasHong KongHungaryIndiaIndonesiaIranIraqIrelandIsraelItalyJamaicaJapanJordanKazakhstanKenyaKoreaKuwaitLaosLatin AmericaLatviaLebanonLiberiaLithuaniaMalaysiaMexicoMicronesiaMiddle AfricaMoldovaMoroccoNepalNetherlandsNigeriaNorth AmericaNorth MacedoniaNorthern AfricaNorthern EuropeNorwayOceaniaPakistanPanamaPeruPhilippinesPolandPortugalRomaniaRussiaSaudi ArabiaScotlandSenegalSerbiaSierra LeoneSingaporeSomaliaSouth AfricaSouth AmericaSouth Central AsiaSouth Eastern AsiaSouthern EuropeSpainSri LankaSt. Vincent and the GrenadinesSudanSwedenSwitzerlandSyriaTaiwanThailandTrinidad and TobagoTurkeyUgandaUkraineUruguayUzbekistanVenezuelaVietnamWest IndiesWestern AfricaWestern AsiaWestern EuropeYemenZaireZimbabweAzores
Immigrants from Nicaragua
Race
Ancestry
AfghanAfricanAlaska NativeAlaskan AthabascanAlbanianAleutAlsatianAmericanApacheArabArapahoArgentineanArmenianAssyrian/Chaldean/SyriacAustralianAustrianBahamianBangladeshiBasqueBelgianBelizeanBermudanBhutaneseBlackfeetBolivianBrazilianBritishBritish West IndianBulgarianBurmeseCajunCambodianCanadianCape VerdeanCarpatho RusynCelticCentral AmericanCentral American IndianCherokeeCheyenneChickasawChileanChineseChippewaChoctawColombianColvilleComancheCosta RicanCreeCreekCroatianCrowCubanCypriotCzechCzechoslovakianDanishDelawareDominicanDutchDutch West IndianEastern EuropeanEcuadorianEgyptianEnglishEstonianEthiopianEuropeanFijianFilipinoFinnishFrenchFrench American IndianFrench CanadianGermanGerman RussianGhanaianGreekGuamanian/ChamorroGuatemalanGuyaneseHaitianHmongHonduranHopiHoumaHungarianIcelanderIndian (Asian)IndonesianInupiatIranianIraqiIrishIroquoisIsraeliItalianJamaicanJapaneseJordanianKenyanKiowaKoreanLaotianLatvianLebaneseLiberianLithuanianLumbeeLuxembourgerMacedonianMalaysianMalteseMarshalleseMenomineeMexicanMexican American IndianMongolianMoroccanNative HawaiianNavajoNepaleseNew ZealanderNicaraguanNigerianNorthern EuropeanNorwegianOkinawanOsageOttawaPaiutePakistaniPalestinianPanamanianParaguayanPennsylvania GermanPeruvianPimaPolishPortuguesePotawatomiPuebloPuerto RicanPuget Sound SalishRomanianRussianSalvadoranSamoanScandinavianScotch-IrishScottishSeminoleSenegaleseSerbianShoshoneSierra LeoneanSiouxSlavicSlovakSloveneSomaliSouth AfricanSouth AmericanSouth American IndianSoviet UnionSpaniardSpanishSpanish AmericanSpanish American IndianSri LankanSubsaharan AfricanSudaneseSwedishSwissSyrianTaiwaneseThaiTlingit-HaidaTohono O'OdhamTonganTrinidadian and TobagonianTsimshianTurkishU.S. Virgin IslanderUgandanUkrainianUruguayanUteVenezuelanVietnameseWelshWest IndianYakamaYaquiYugoslavianYumanYup'ikZimbabwean
Immigration
NonimmigrantsImmigrantsAfghanistanAfricaAlbaniaArgentinaArmeniaAsiaAustraliaAustriaBahamasBangladeshBarbadosBelarusBelgiumBelizeBoliviaBosnia and HerzegovinaBrazilBulgariaBurma/MyanmarCabo VerdeCambodiaCameroonCanadaCaribbeanCentral AmericaChileChinaColombiaCongoCosta RicaCroatiaCubaCzechoslovakiaDenmarkDominicaDominican RepublicEastern AfricaEastern AsiaEastern EuropeEcuadorEgyptEl SalvadorEnglandEritreaEthiopiaEuropeFijiFranceGermanyGhanaGreeceGrenadaGuatemalaGuyanaHaitiHondurasHong KongHungaryIndiaIndonesiaIranIraqIrelandIsraelItalyJamaicaJapanJordanKazakhstanKenyaKoreaKuwaitLaosLatin AmericaLatviaLebanonLiberiaLithuaniaMalaysiaMexicoMicronesiaMiddle AfricaMoldovaMoroccoNepalNetherlandsNicaraguaNigeriaNorth AmericaNorth MacedoniaNorthern AfricaNorthern EuropeNorwayOceaniaPakistanPanamaPeruPhilippinesPolandPortugalRomaniaRussiaSaudi ArabiaScotlandSenegalSerbiaSierra LeoneSingaporeSomaliaSouth AfricaSouth AmericaSouth Central AsiaSouth Eastern AsiaSouthern EuropeSpainSri LankaSt. Vincent and the GrenadinesSudanSwedenSwitzerlandSyriaTaiwanThailandTrinidad and TobagoTurkeyUgandaUkraineUruguayUzbekistanVenezuelaVietnamWest IndiesWestern AfricaWestern AsiaWestern EuropeYemenZaireZimbabweAzores
Unemployment Among Women with Children Under 18 years
Income
Poverty
Unemployment
Labor Participation
Family Structure
Vehicle Availability
Education Level
Disability

Unemployment Among Women with Children Under 18 years Comparison

Barbadians

Immigrants from Nicaragua

Tragic
Tragic
6.4%
UNEMPLOYMENT AMONG WOMEN WITH CHILDREN UNDER 18 YEARS
0.0/ 100
METRIC RATING
295th/ 347
METRIC RANK
5.7%
UNEMPLOYMENT AMONG WOMEN WITH CHILDREN UNDER 18 YEARS
7.0/ 100
METRIC RATING
218th/ 347
METRIC RANK

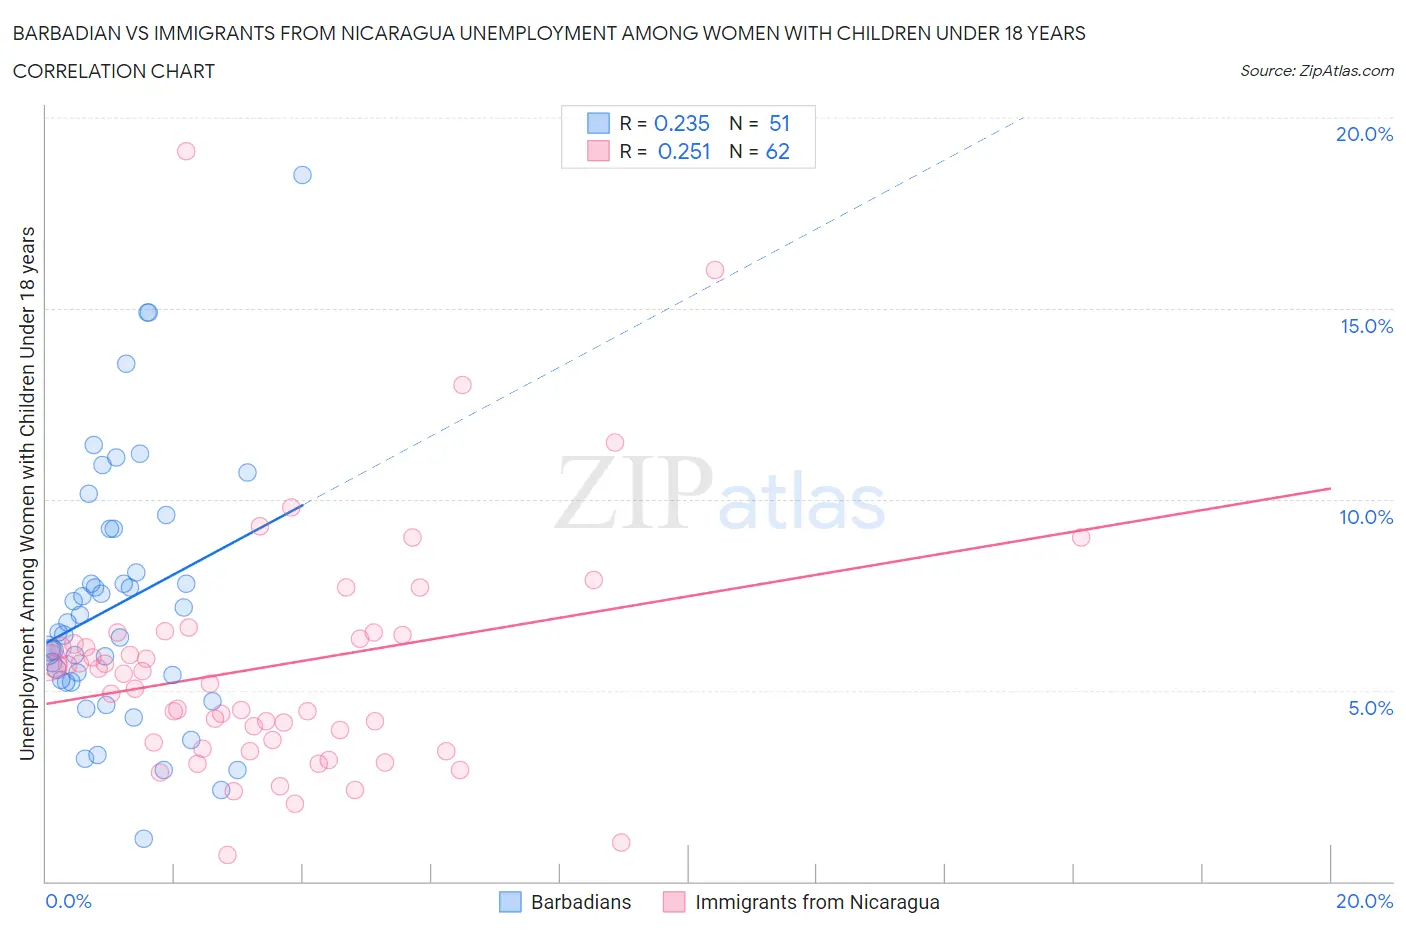
Barbadian vs Immigrants from Nicaragua Unemployment Among Women with Children Under 18 years Correlation Chart

The statistical analysis conducted on geographies consisting of 139,822,827 people shows a weak positive correlation between the proportion of Barbadians and unemployment rate among women with children under the age of 18 in the United States with a correlation coefficient (R) of 0.235 and weighted average of 6.4%. Similarly, the statistical analysis conducted on geographies consisting of 232,845,924 people shows a weak positive correlation between the proportion of Immigrants from Nicaragua and unemployment rate among women with children under the age of 18 in the United States with a correlation coefficient (R) of 0.251 and weighted average of 5.7%, a difference of 12.1%.
Barbadian vs Immigrants from Nicaragua Unemployment Among Women with Children Under 18 years

Unemployment Among Women with Children Under 18 years Correlation Summary

MeasurementBarbadianImmigrants from Nicaragua
Minimum1.1%0.70%
Maximum18.5%19.1%
Range17.4%18.4%
Mean7.3%5.6%
Median6.5%5.3%
Interquartile 25% (IQ1)5.2%3.6%
Interquartile 75% (IQ3)9.2%6.5%
Interquartile Range (IQR)4.0%2.8%
Standard Deviation (Sample)3.4%3.2%
Standard Deviation (Population)3.4%3.2%

Similar Demographics by Unemployment Among Women with Children Under 18 years

Demographics Similar to Barbadians by Unemployment Among Women with Children Under 18 years

In terms of unemployment among women with children under 18 years, the demographic groups most similar to Barbadians are Haitian (6.4%, a difference of 0.020%), Immigrants from Senegal (6.4%, a difference of 0.060%), Honduran (6.4%, a difference of 0.080%), Immigrants from Bangladesh (6.4%, a difference of 0.11%), and Mexican (6.4%, a difference of 0.14%).
DemographicsRating | RankUnemployment Among Women with Children Under 18 years
Cree
0.0
/100
|
#288
Tragic
6.3%
Immigrants | Caribbean
0.0
/100
|
#289
Tragic
6.4%
Blackfeet
0.0
/100
|
#290
Tragic
6.4%
Immigrants | Guatemala
0.0
/100
|
#291
Tragic
6.4%
Mexicans
0.0
/100
|
#292
Tragic
6.4%
Immigrants | Bangladesh
0.0
/100
|
#293
Tragic
6.4%
Hondurans
0.0
/100
|
#294
Tragic
6.4%
Barbadians
0.0
/100
|
#295
Tragic
6.4%
Haitians
0.0
/100
|
#296
Tragic
6.4%
Immigrants | Senegal
0.0
/100
|
#297
Tragic
6.4%
Immigrants | Latin America
0.0
/100
|
#298
Tragic
6.4%
Jamaicans
0.0
/100
|
#299
Tragic
6.4%
Immigrants | Jamaica
0.0
/100
|
#300
Tragic
6.4%
Immigrants | Haiti
0.0
/100
|
#301
Tragic
6.4%
Immigrants | Armenia
0.0
/100
|
#302
Tragic
6.5%

Demographics Similar to Immigrants from Nicaragua by Unemployment Among Women with Children Under 18 years

In terms of unemployment among women with children under 18 years, the demographic groups most similar to Immigrants from Nicaragua are Immigrants from Brazil (5.7%, a difference of 0.030%), Immigrants from Peru (5.7%, a difference of 0.12%), Iroquois (5.7%, a difference of 0.13%), Immigrants from Fiji (5.7%, a difference of 0.19%), and Immigrants from Uganda (5.7%, a difference of 0.22%).
DemographicsRating | RankUnemployment Among Women with Children Under 18 years
Panamanians
10.1
/100
|
#211
Poor
5.7%
South Americans
10.0
/100
|
#212
Poor
5.7%
Americans
8.9
/100
|
#213
Tragic
5.7%
Japanese
8.7
/100
|
#214
Tragic
5.7%
Immigrants | Uganda
7.9
/100
|
#215
Tragic
5.7%
Immigrants | Peru
7.4
/100
|
#216
Tragic
5.7%
Immigrants | Brazil
7.1
/100
|
#217
Tragic
5.7%
Immigrants | Nicaragua
7.0
/100
|
#218
Tragic
5.7%
Iroquois
6.5
/100
|
#219
Tragic
5.7%
Immigrants | Fiji
6.3
/100
|
#220
Tragic
5.7%
Pennsylvania Germans
5.7
/100
|
#221
Tragic
5.7%
Osage
5.0
/100
|
#222
Tragic
5.7%
Potawatomi
5.0
/100
|
#223
Tragic
5.7%
Immigrants | Syria
4.6
/100
|
#224
Tragic
5.7%
Armenians
4.5
/100
|
#225
Tragic
5.7%