Barbadian vs Immigrants from Nicaragua Average Family Size
COMPARE
Barbadian
Immigrants from Nicaragua
Average Family Size
Average Family Size Comparison
Barbadians
Immigrants from Nicaragua
3.29
AVERAGE FAMILY SIZE
98.6/ 100
METRIC RATING
98th/ 347
METRIC RANK
3.37
AVERAGE FAMILY SIZE
100.0/ 100
METRIC RATING
48th/ 347
METRIC RANK
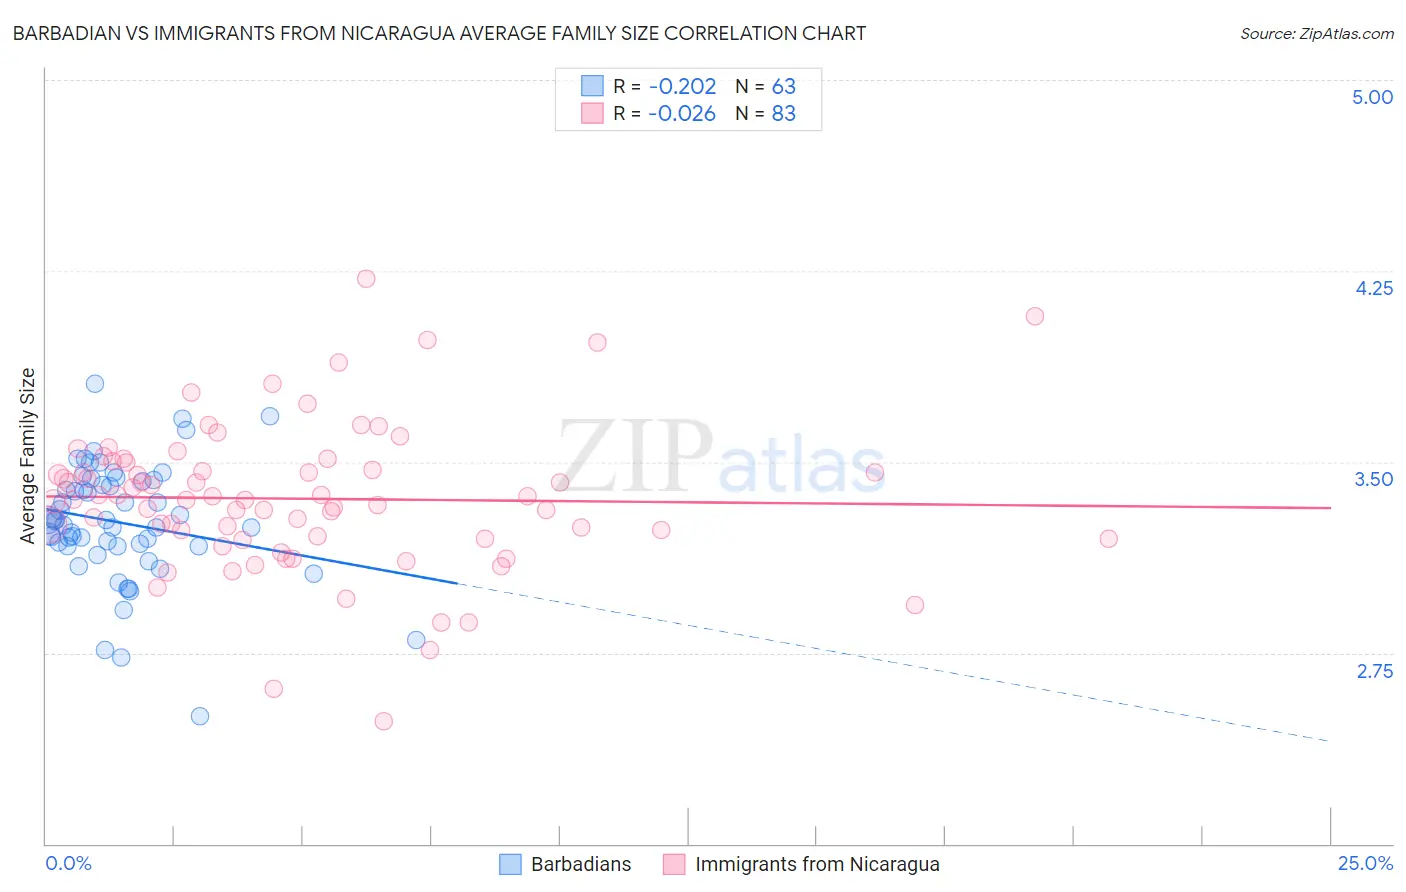
Barbadian vs Immigrants from Nicaragua Average Family Size Correlation Chart
The statistical analysis conducted on geographies consisting of 141,251,330 people shows a weak negative correlation between the proportion of Barbadians and average family size in the United States with a correlation coefficient (R) of -0.202 and weighted average of 3.29. Similarly, the statistical analysis conducted on geographies consisting of 236,326,320 people shows no correlation between the proportion of Immigrants from Nicaragua and average family size in the United States with a correlation coefficient (R) of -0.026 and weighted average of 3.37, a difference of 2.4%.
Average Family Size Correlation Summary
| Measurement | Barbadian | Immigrants from Nicaragua |
| Minimum | 2.50 | 2.48 |
| Maximum | 3.81 | 4.22 |
| Range | 1.31 | 1.74 |
| Mean | 3.26 | 3.36 |
| Median | 3.27 | 3.35 |
| Interquartile 25% (IQ1) | 3.17 | 3.20 |
| Interquartile 75% (IQ3) | 3.43 | 3.50 |
| Interquartile Range (IQR) | 0.26 | 0.30 |
| Standard Deviation (Sample) | 0.23 | 0.29 |
| Standard Deviation (Population) | 0.23 | 0.29 |
Similar Demographics by Average Family Size
Demographics Similar to Barbadians by Average Family Size
In terms of average family size, the demographic groups most similar to Barbadians are Immigrants from Oceania (3.29, a difference of 0.0%), Nigerian (3.29, a difference of 0.0%), Guamanian/Chamorro (3.29, a difference of 0.010%), Immigrants from Burma/Myanmar (3.29, a difference of 0.030%), and West Indian (3.29, a difference of 0.030%).
| Demographics | Rating | Rank | Average Family Size |
| Immigrants | Pakistan | 99.2 /100 | #91 | Exceptional 3.30 |
| Immigrants | Cameroon | 99.2 /100 | #92 | Exceptional 3.30 |
| Peruvians | 99.2 /100 | #93 | Exceptional 3.30 |
| Sierra Leoneans | 99.0 /100 | #94 | Exceptional 3.30 |
| Immigrants | Lebanon | 99.0 /100 | #95 | Exceptional 3.30 |
| U.S. Virgin Islanders | 98.8 /100 | #96 | Exceptional 3.29 |
| Immigrants | Oceania | 98.7 /100 | #97 | Exceptional 3.29 |
| Barbadians | 98.6 /100 | #98 | Exceptional 3.29 |
| Nigerians | 98.6 /100 | #99 | Exceptional 3.29 |
| Guamanians/Chamorros | 98.6 /100 | #100 | Exceptional 3.29 |
| Immigrants | Burma/Myanmar | 98.6 /100 | #101 | Exceptional 3.29 |
| West Indians | 98.5 /100 | #102 | Exceptional 3.29 |
| Immigrants | Western Africa | 98.4 /100 | #103 | Exceptional 3.29 |
| Bolivians | 98.3 /100 | #104 | Exceptional 3.29 |
| Immigrants | Ghana | 98.1 /100 | #105 | Exceptional 3.29 |
Demographics Similar to Immigrants from Nicaragua by Average Family Size
In terms of average family size, the demographic groups most similar to Immigrants from Nicaragua are Vietnamese (3.37, a difference of 0.0%), Haitian (3.37, a difference of 0.040%), Bangladeshi (3.37, a difference of 0.060%), Shoshone (3.37, a difference of 0.10%), and Alaska Native (3.37, a difference of 0.14%).
| Demographics | Rating | Rank | Average Family Size |
| Marshallese | 100.0 /100 | #41 | Exceptional 3.38 |
| Immigrants | Vietnam | 100.0 /100 | #42 | Exceptional 3.38 |
| Immigrants | Philippines | 100.0 /100 | #43 | Exceptional 3.37 |
| Alaska Natives | 100.0 /100 | #44 | Exceptional 3.37 |
| Shoshone | 100.0 /100 | #45 | Exceptional 3.37 |
| Haitians | 100.0 /100 | #46 | Exceptional 3.37 |
| Vietnamese | 100.0 /100 | #47 | Exceptional 3.37 |
| Immigrants | Nicaragua | 100.0 /100 | #48 | Exceptional 3.37 |
| Bangladeshis | 100.0 /100 | #49 | Exceptional 3.37 |
| Immigrants | Bangladesh | 100.0 /100 | #50 | Exceptional 3.36 |
| Nicaraguans | 100.0 /100 | #51 | Exceptional 3.36 |
| Fijians | 100.0 /100 | #52 | Exceptional 3.36 |
| Koreans | 100.0 /100 | #53 | Exceptional 3.36 |
| Immigrants | South Eastern Asia | 100.0 /100 | #54 | Exceptional 3.36 |
| Immigrants | Honduras | 100.0 /100 | #55 | Exceptional 3.36 |