Bangladeshi vs Subsaharan African Child Poverty Among Boys Under 16
COMPARE
Bangladeshi
Subsaharan African
Child Poverty Among Boys Under 16
Child Poverty Among Boys Under 16 Comparison
Bangladeshis
Sub-Saharan Africans
20.0%
CHILD POVERTY AMONG BOYS UNDER 16
0.0/ 100
METRIC RATING
279th/ 347
METRIC RANK
20.0%
CHILD POVERTY AMONG BOYS UNDER 16
0.0/ 100
METRIC RATING
276th/ 347
METRIC RANK
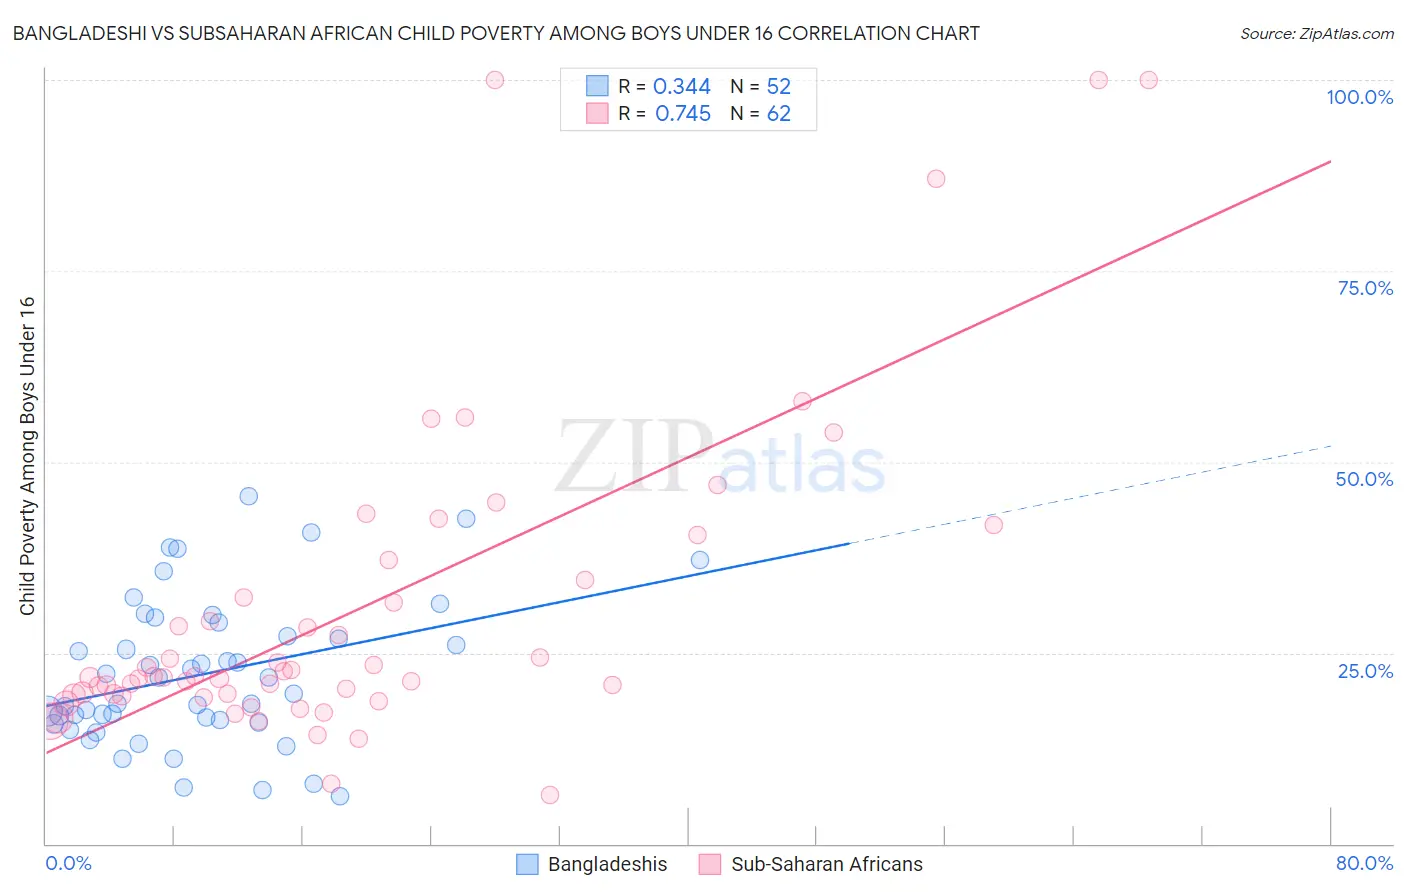
Bangladeshi vs Subsaharan African Child Poverty Among Boys Under 16 Correlation Chart
The statistical analysis conducted on geographies consisting of 140,641,958 people shows a mild positive correlation between the proportion of Bangladeshis and poverty level among boys under the age of 16 in the United States with a correlation coefficient (R) of 0.344 and weighted average of 20.0%. Similarly, the statistical analysis conducted on geographies consisting of 497,613,414 people shows a strong positive correlation between the proportion of Sub-Saharan Africans and poverty level among boys under the age of 16 in the United States with a correlation coefficient (R) of 0.745 and weighted average of 20.0%, a difference of 0.25%.
Child Poverty Among Boys Under 16 Correlation Summary
| Measurement | Bangladeshi | Subsaharan African |
| Minimum | 6.2% | 6.5% |
| Maximum | 45.5% | 100.0% |
| Range | 39.2% | 93.5% |
| Mean | 22.2% | 30.6% |
| Median | 20.7% | 21.9% |
| Interquartile 25% (IQ1) | 16.0% | 19.4% |
| Interquartile 75% (IQ3) | 28.1% | 34.6% |
| Interquartile Range (IQR) | 12.1% | 15.2% |
| Standard Deviation (Sample) | 9.5% | 21.0% |
| Standard Deviation (Population) | 9.5% | 20.8% |
Demographics Similar to Bangladeshis and Sub-Saharan Africans by Child Poverty Among Boys Under 16
In terms of child poverty among boys under 16, the demographic groups most similar to Bangladeshis are Central American (20.1%, a difference of 0.12%), Immigrants from West Indies (20.0%, a difference of 0.13%), Immigrants from Barbados (20.0%, a difference of 0.15%), Immigrants from Zaire (20.1%, a difference of 0.18%), and Comanche (20.1%, a difference of 0.23%). Similarly, the demographic groups most similar to Sub-Saharan Africans are Immigrants from Barbados (20.0%, a difference of 0.10%), Immigrants from West Indies (20.0%, a difference of 0.12%), Jamaican (20.0%, a difference of 0.17%), Immigrants from Bangladesh (19.9%, a difference of 0.29%), and Central American (20.1%, a difference of 0.37%).
| Demographics | Rating | Rank | Child Poverty Among Boys Under 16 |
| Vietnamese | 0.1 /100 | #267 | Tragic 19.6% |
| Spanish American Indians | 0.1 /100 | #268 | Tragic 19.6% |
| Immigrants | Cabo Verde | 0.1 /100 | #269 | Tragic 19.7% |
| Cherokee | 0.1 /100 | #270 | Tragic 19.7% |
| Chickasaw | 0.1 /100 | #271 | Tragic 19.8% |
| Immigrants | Ecuador | 0.1 /100 | #272 | Tragic 19.8% |
| Belizeans | 0.1 /100 | #273 | Tragic 19.9% |
| Immigrants | Bangladesh | 0.0 /100 | #274 | Tragic 19.9% |
| Jamaicans | 0.0 /100 | #275 | Tragic 20.0% |
| Sub-Saharan Africans | 0.0 /100 | #276 | Tragic 20.0% |
| Immigrants | Barbados | 0.0 /100 | #277 | Tragic 20.0% |
| Immigrants | West Indies | 0.0 /100 | #278 | Tragic 20.0% |
| Bangladeshis | 0.0 /100 | #279 | Tragic 20.0% |
| Central Americans | 0.0 /100 | #280 | Tragic 20.1% |
| Immigrants | Zaire | 0.0 /100 | #281 | Tragic 20.1% |
| Comanche | 0.0 /100 | #282 | Tragic 20.1% |
| Immigrants | Jamaica | 0.0 /100 | #283 | Tragic 20.1% |
| Barbadians | 0.0 /100 | #284 | Tragic 20.2% |
| Arapaho | 0.0 /100 | #285 | Tragic 20.2% |
| West Indians | 0.0 /100 | #286 | Tragic 20.3% |
| Immigrants | Belize | 0.0 /100 | #287 | Tragic 20.3% |