Bangladeshi vs Subsaharan African Per Capita Income
COMPARE
Bangladeshi
Subsaharan African
Per Capita Income
Per Capita Income Comparison
Bangladeshis
Sub-Saharan Africans
$35,897
PER CAPITA INCOME
0.0/ 100
METRIC RATING
318th/ 347
METRIC RANK
$40,152
PER CAPITA INCOME
1.9/ 100
METRIC RATING
245th/ 347
METRIC RANK
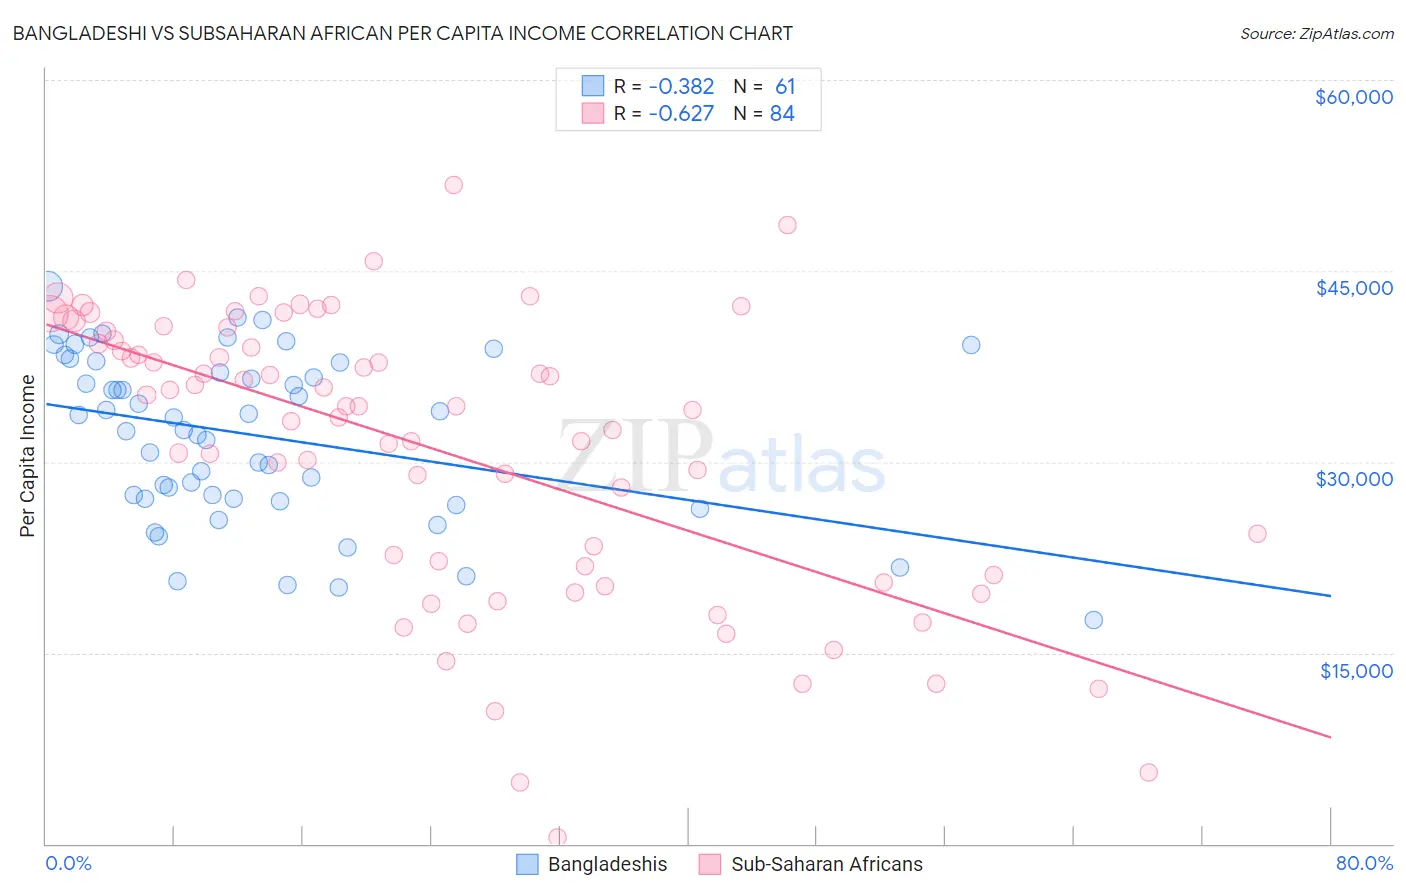
Bangladeshi vs Subsaharan African Per Capita Income Correlation Chart
The statistical analysis conducted on geographies consisting of 141,454,199 people shows a mild negative correlation between the proportion of Bangladeshis and per capita income in the United States with a correlation coefficient (R) of -0.382 and weighted average of $35,897. Similarly, the statistical analysis conducted on geographies consisting of 508,279,002 people shows a significant negative correlation between the proportion of Sub-Saharan Africans and per capita income in the United States with a correlation coefficient (R) of -0.627 and weighted average of $40,152, a difference of 11.8%.
Per Capita Income Correlation Summary
| Measurement | Bangladeshi | Subsaharan African |
| Minimum | $17,577 | $461 |
| Maximum | $43,772 | $51,790 |
| Range | $26,195 | $51,329 |
| Mean | $32,070 | $31,049 |
| Median | $33,478 | $34,354 |
| Interquartile 25% (IQ1) | $27,131 | $21,454 |
| Interquartile 75% (IQ3) | $37,833 | $39,919 |
| Interquartile Range (IQR) | $10,702 | $18,464 |
| Standard Deviation (Sample) | $6,476 | $11,215 |
| Standard Deviation (Population) | $6,423 | $11,148 |
Similar Demographics by Per Capita Income
Demographics Similar to Bangladeshis by Per Capita Income
In terms of per capita income, the demographic groups most similar to Bangladeshis are Dutch West Indian ($35,922, a difference of 0.070%), Choctaw ($35,999, a difference of 0.28%), Immigrants from Congo ($35,720, a difference of 0.50%), Hispanic or Latino ($35,688, a difference of 0.59%), and Yaqui ($36,112, a difference of 0.60%).
| Demographics | Rating | Rank | Per Capita Income |
| Chippewa | 0.0 /100 | #311 | Tragic $36,631 |
| Chickasaw | 0.0 /100 | #312 | Tragic $36,475 |
| Bahamians | 0.0 /100 | #313 | Tragic $36,427 |
| Seminole | 0.0 /100 | #314 | Tragic $36,180 |
| Yaqui | 0.0 /100 | #315 | Tragic $36,112 |
| Choctaw | 0.0 /100 | #316 | Tragic $35,999 |
| Dutch West Indians | 0.0 /100 | #317 | Tragic $35,922 |
| Bangladeshis | 0.0 /100 | #318 | Tragic $35,897 |
| Immigrants | Congo | 0.0 /100 | #319 | Tragic $35,720 |
| Hispanics or Latinos | 0.0 /100 | #320 | Tragic $35,688 |
| Blacks/African Americans | 0.0 /100 | #321 | Tragic $35,564 |
| Creek | 0.0 /100 | #322 | Tragic $35,546 |
| Cheyenne | 0.0 /100 | #323 | Tragic $35,276 |
| Kiowa | 0.0 /100 | #324 | Tragic $35,102 |
| Immigrants | Central America | 0.0 /100 | #325 | Tragic $34,974 |
Demographics Similar to Sub-Saharan Africans by Per Capita Income
In terms of per capita income, the demographic groups most similar to Sub-Saharan Africans are French American Indian ($40,244, a difference of 0.23%), Cree ($40,056, a difference of 0.24%), German Russian ($40,266, a difference of 0.28%), Immigrants from Western Africa ($40,294, a difference of 0.35%), and British West Indian ($40,330, a difference of 0.44%).
| Demographics | Rating | Rank | Per Capita Income |
| Somalis | 2.4 /100 | #238 | Tragic $40,367 |
| Tsimshian | 2.4 /100 | #239 | Tragic $40,344 |
| Immigrants | Nigeria | 2.3 /100 | #240 | Tragic $40,339 |
| British West Indians | 2.3 /100 | #241 | Tragic $40,330 |
| Immigrants | Western Africa | 2.2 /100 | #242 | Tragic $40,294 |
| German Russians | 2.2 /100 | #243 | Tragic $40,266 |
| French American Indians | 2.1 /100 | #244 | Tragic $40,244 |
| Sub-Saharan Africans | 1.9 /100 | #245 | Tragic $40,152 |
| Cree | 1.7 /100 | #246 | Tragic $40,056 |
| Immigrants | Somalia | 1.6 /100 | #247 | Tragic $39,974 |
| Cape Verdeans | 1.5 /100 | #248 | Tragic $39,935 |
| Japanese | 1.4 /100 | #249 | Tragic $39,870 |
| Immigrants | Burma/Myanmar | 1.3 /100 | #250 | Tragic $39,827 |
| Samoans | 1.3 /100 | #251 | Tragic $39,826 |
| Immigrants | Azores | 1.0 /100 | #252 | Tragic $39,608 |