Bangladeshi vs Immigrants from Germany Child Poverty Among Boys Under 16
COMPARE
Bangladeshi
Immigrants from Germany
Child Poverty Among Boys Under 16
Child Poverty Among Boys Under 16 Comparison
Bangladeshis
Immigrants from Germany
20.0%
CHILD POVERTY AMONG BOYS UNDER 16
0.0/ 100
METRIC RATING
279th/ 347
METRIC RANK
16.2%
CHILD POVERTY AMONG BOYS UNDER 16
63.6/ 100
METRIC RATING
166th/ 347
METRIC RANK
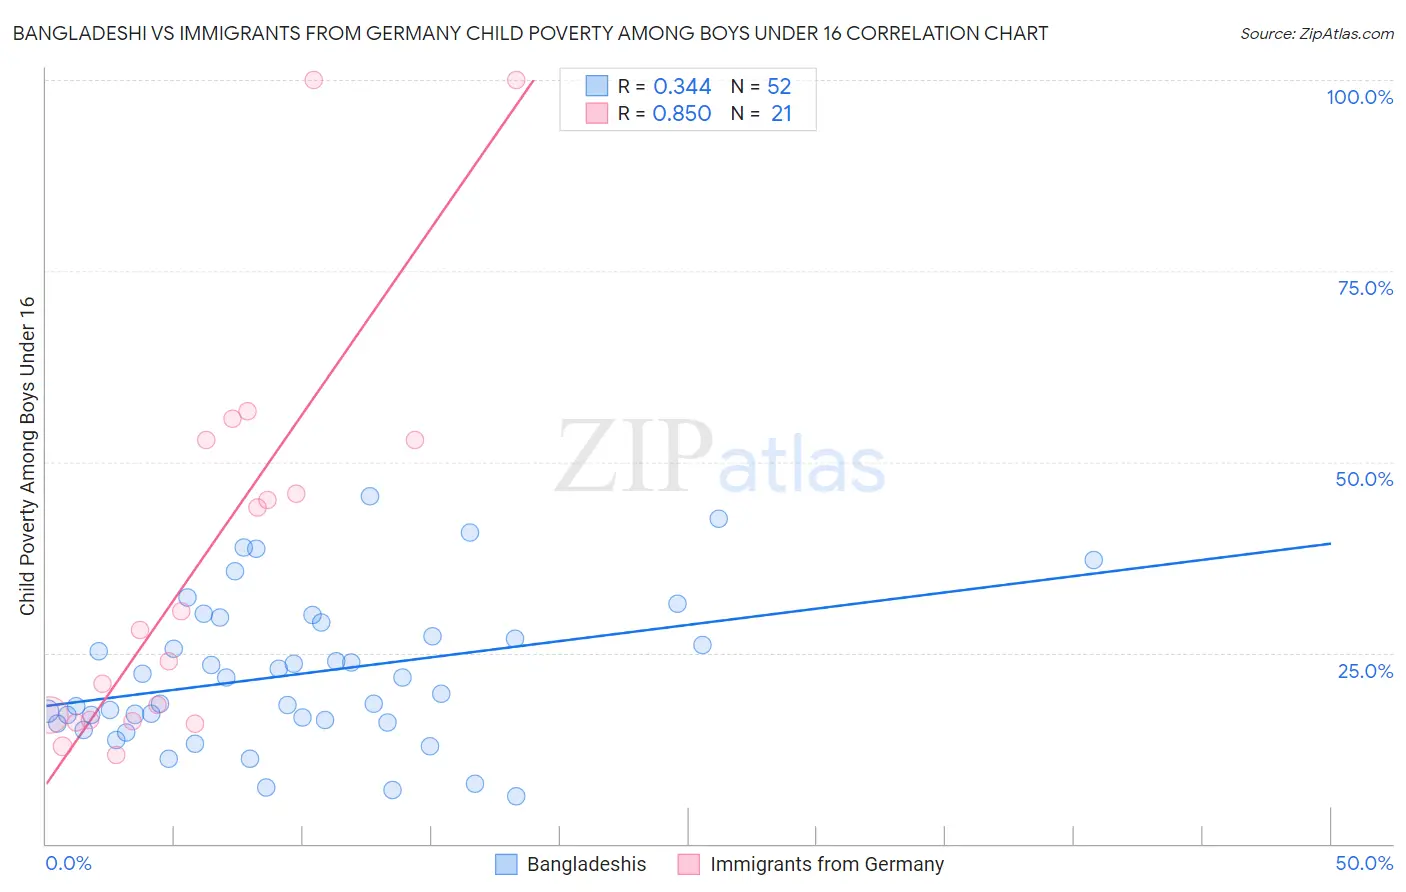
Bangladeshi vs Immigrants from Germany Child Poverty Among Boys Under 16 Correlation Chart
The statistical analysis conducted on geographies consisting of 140,641,958 people shows a mild positive correlation between the proportion of Bangladeshis and poverty level among boys under the age of 16 in the United States with a correlation coefficient (R) of 0.344 and weighted average of 20.0%. Similarly, the statistical analysis conducted on geographies consisting of 453,739,564 people shows a very strong positive correlation between the proportion of Immigrants from Germany and poverty level among boys under the age of 16 in the United States with a correlation coefficient (R) of 0.850 and weighted average of 16.2%, a difference of 23.8%.
Child Poverty Among Boys Under 16 Correlation Summary
| Measurement | Bangladeshi | Immigrants from Germany |
| Minimum | 6.2% | 11.6% |
| Maximum | 45.5% | 100.0% |
| Range | 39.2% | 88.4% |
| Mean | 22.2% | 37.1% |
| Median | 20.7% | 28.0% |
| Interquartile 25% (IQ1) | 16.0% | 16.1% |
| Interquartile 75% (IQ3) | 28.1% | 52.9% |
| Interquartile Range (IQR) | 12.1% | 36.8% |
| Standard Deviation (Sample) | 9.5% | 26.2% |
| Standard Deviation (Population) | 9.5% | 25.5% |
Similar Demographics by Child Poverty Among Boys Under 16
Demographics Similar to Bangladeshis by Child Poverty Among Boys Under 16
In terms of child poverty among boys under 16, the demographic groups most similar to Bangladeshis are Central American (20.1%, a difference of 0.12%), Immigrants from West Indies (20.0%, a difference of 0.13%), Immigrants from Barbados (20.0%, a difference of 0.15%), Immigrants from Zaire (20.1%, a difference of 0.18%), and Comanche (20.1%, a difference of 0.23%).
| Demographics | Rating | Rank | Child Poverty Among Boys Under 16 |
| Immigrants | Ecuador | 0.1 /100 | #272 | Tragic 19.8% |
| Belizeans | 0.1 /100 | #273 | Tragic 19.9% |
| Immigrants | Bangladesh | 0.0 /100 | #274 | Tragic 19.9% |
| Jamaicans | 0.0 /100 | #275 | Tragic 20.0% |
| Sub-Saharan Africans | 0.0 /100 | #276 | Tragic 20.0% |
| Immigrants | Barbados | 0.0 /100 | #277 | Tragic 20.0% |
| Immigrants | West Indies | 0.0 /100 | #278 | Tragic 20.0% |
| Bangladeshis | 0.0 /100 | #279 | Tragic 20.0% |
| Central Americans | 0.0 /100 | #280 | Tragic 20.1% |
| Immigrants | Zaire | 0.0 /100 | #281 | Tragic 20.1% |
| Comanche | 0.0 /100 | #282 | Tragic 20.1% |
| Immigrants | Jamaica | 0.0 /100 | #283 | Tragic 20.1% |
| Barbadians | 0.0 /100 | #284 | Tragic 20.2% |
| Arapaho | 0.0 /100 | #285 | Tragic 20.2% |
| West Indians | 0.0 /100 | #286 | Tragic 20.3% |
Demographics Similar to Immigrants from Germany by Child Poverty Among Boys Under 16
In terms of child poverty among boys under 16, the demographic groups most similar to Immigrants from Germany are Colombian (16.1%, a difference of 0.20%), Immigrants from Albania (16.1%, a difference of 0.55%), Costa Rican (16.1%, a difference of 0.57%), Guamanian/Chamorro (16.1%, a difference of 0.77%), and Afghan (16.3%, a difference of 0.97%).
| Demographics | Rating | Rank | Child Poverty Among Boys Under 16 |
| Immigrants | Chile | 74.8 /100 | #159 | Good 15.9% |
| Immigrants | Northern Africa | 71.3 /100 | #160 | Good 16.0% |
| Immigrants | Oceania | 71.3 /100 | #161 | Good 16.0% |
| Guamanians/Chamorros | 69.6 /100 | #162 | Good 16.1% |
| Costa Ricans | 68.1 /100 | #163 | Good 16.1% |
| Immigrants | Albania | 67.9 /100 | #164 | Good 16.1% |
| Colombians | 65.2 /100 | #165 | Good 16.1% |
| Immigrants | Germany | 63.6 /100 | #166 | Good 16.2% |
| Afghans | 55.4 /100 | #167 | Average 16.3% |
| South Americans | 55.3 /100 | #168 | Average 16.3% |
| Immigrants | Saudi Arabia | 53.6 /100 | #169 | Average 16.4% |
| Immigrants | Bosnia and Herzegovina | 51.7 /100 | #170 | Average 16.4% |
| Immigrants | Ethiopia | 51.3 /100 | #171 | Average 16.4% |
| Immigrants | Colombia | 50.8 /100 | #172 | Average 16.4% |
| Tsimshian | 50.5 /100 | #173 | Average 16.4% |