Immigrants from Sierra Leone vs Subsaharan African Child Poverty Among Boys Under 16
COMPARE
Immigrants from Sierra Leone
Subsaharan African
Child Poverty Among Boys Under 16
Child Poverty Among Boys Under 16 Comparison
Immigrants from Sierra Leone
Sub-Saharan Africans
17.3%
CHILD POVERTY AMONG BOYS UNDER 16
13.4/ 100
METRIC RATING
202nd/ 347
METRIC RANK
20.0%
CHILD POVERTY AMONG BOYS UNDER 16
0.0/ 100
METRIC RATING
276th/ 347
METRIC RANK
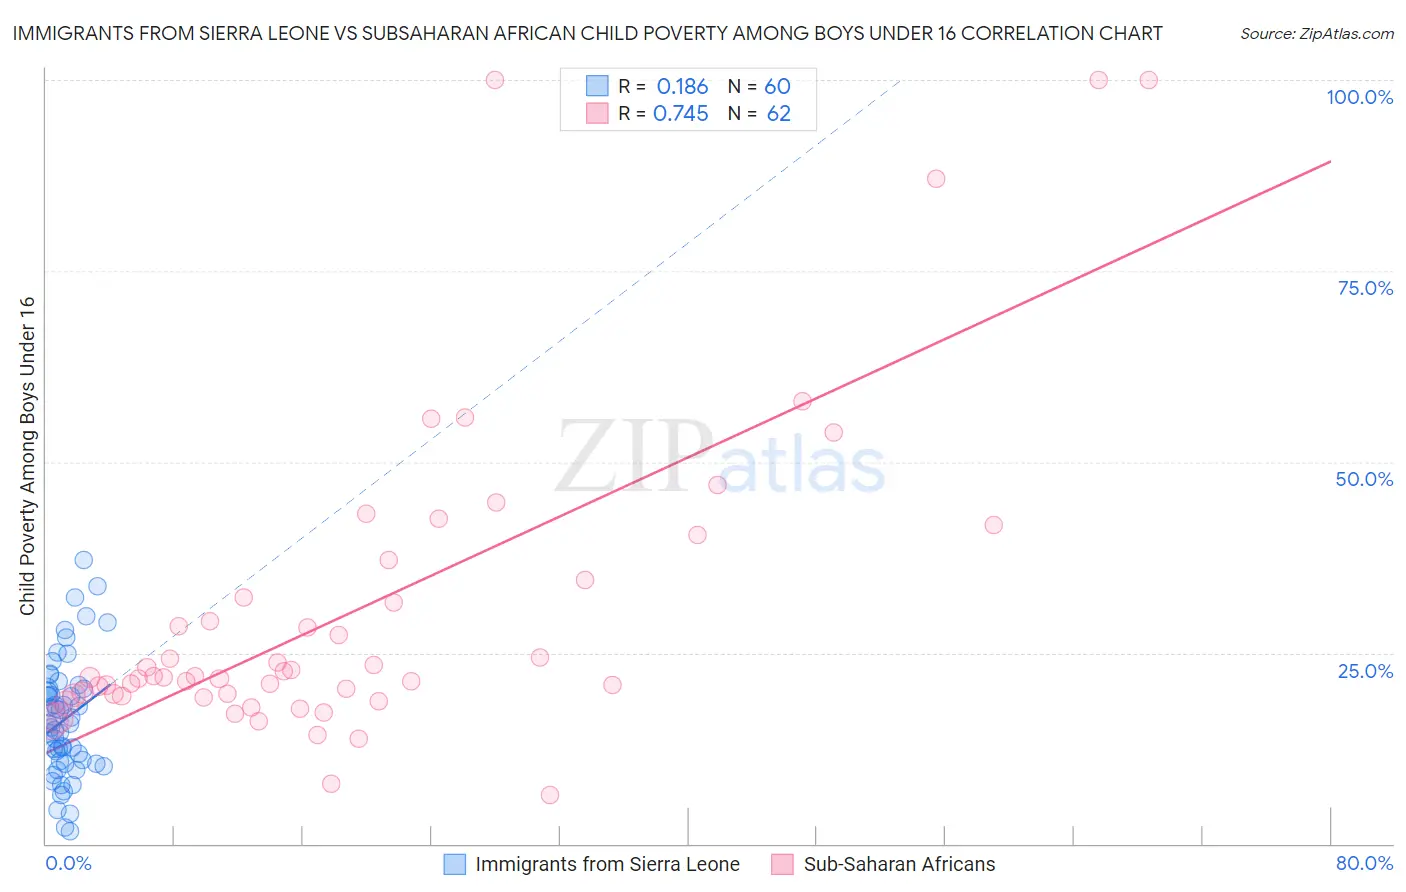
Immigrants from Sierra Leone vs Subsaharan African Child Poverty Among Boys Under 16 Correlation Chart
The statistical analysis conducted on geographies consisting of 101,288,430 people shows a poor positive correlation between the proportion of Immigrants from Sierra Leone and poverty level among boys under the age of 16 in the United States with a correlation coefficient (R) of 0.186 and weighted average of 17.3%. Similarly, the statistical analysis conducted on geographies consisting of 497,613,414 people shows a strong positive correlation between the proportion of Sub-Saharan Africans and poverty level among boys under the age of 16 in the United States with a correlation coefficient (R) of 0.745 and weighted average of 20.0%, a difference of 15.6%.
Child Poverty Among Boys Under 16 Correlation Summary
| Measurement | Immigrants from Sierra Leone | Subsaharan African |
| Minimum | 1.6% | 6.5% |
| Maximum | 37.1% | 100.0% |
| Range | 35.5% | 93.5% |
| Mean | 16.3% | 30.6% |
| Median | 15.7% | 21.9% |
| Interquartile 25% (IQ1) | 10.7% | 19.4% |
| Interquartile 75% (IQ3) | 20.2% | 34.6% |
| Interquartile Range (IQR) | 9.5% | 15.2% |
| Standard Deviation (Sample) | 7.8% | 21.0% |
| Standard Deviation (Population) | 7.7% | 20.8% |
Similar Demographics by Child Poverty Among Boys Under 16
Demographics Similar to Immigrants from Sierra Leone by Child Poverty Among Boys Under 16
In terms of child poverty among boys under 16, the demographic groups most similar to Immigrants from Sierra Leone are Immigrants from Uzbekistan (17.3%, a difference of 0.020%), Immigrants from Afghanistan (17.3%, a difference of 0.060%), Ugandan (17.3%, a difference of 0.22%), Immigrants from Portugal (17.4%, a difference of 0.55%), and German Russian (17.4%, a difference of 0.61%).
| Demographics | Rating | Rank | Child Poverty Among Boys Under 16 |
| Spanish | 20.8 /100 | #195 | Fair 17.0% |
| Spaniards | 20.5 /100 | #196 | Fair 17.1% |
| Immigrants | Kenya | 20.1 /100 | #197 | Fair 17.1% |
| Immigrants | Cameroon | 19.0 /100 | #198 | Poor 17.1% |
| Delaware | 18.8 /100 | #199 | Poor 17.1% |
| Immigrants | Uruguay | 16.9 /100 | #200 | Poor 17.2% |
| Immigrants | Afghanistan | 13.7 /100 | #201 | Poor 17.3% |
| Immigrants | Sierra Leone | 13.4 /100 | #202 | Poor 17.3% |
| Immigrants | Uzbekistan | 13.3 /100 | #203 | Poor 17.3% |
| Ugandans | 12.5 /100 | #204 | Poor 17.3% |
| Immigrants | Portugal | 11.2 /100 | #205 | Poor 17.4% |
| German Russians | 10.9 /100 | #206 | Poor 17.4% |
| Immigrants | Thailand | 8.2 /100 | #207 | Tragic 17.5% |
| Malaysians | 7.6 /100 | #208 | Tragic 17.6% |
| Alaskan Athabascans | 7.3 /100 | #209 | Tragic 17.6% |
Demographics Similar to Sub-Saharan Africans by Child Poverty Among Boys Under 16
In terms of child poverty among boys under 16, the demographic groups most similar to Sub-Saharan Africans are Immigrants from Barbados (20.0%, a difference of 0.10%), Immigrants from West Indies (20.0%, a difference of 0.12%), Jamaican (20.0%, a difference of 0.17%), Bangladeshi (20.0%, a difference of 0.25%), and Immigrants from Bangladesh (19.9%, a difference of 0.29%).
| Demographics | Rating | Rank | Child Poverty Among Boys Under 16 |
| Immigrants | Cabo Verde | 0.1 /100 | #269 | Tragic 19.7% |
| Cherokee | 0.1 /100 | #270 | Tragic 19.7% |
| Chickasaw | 0.1 /100 | #271 | Tragic 19.8% |
| Immigrants | Ecuador | 0.1 /100 | #272 | Tragic 19.8% |
| Belizeans | 0.1 /100 | #273 | Tragic 19.9% |
| Immigrants | Bangladesh | 0.0 /100 | #274 | Tragic 19.9% |
| Jamaicans | 0.0 /100 | #275 | Tragic 20.0% |
| Sub-Saharan Africans | 0.0 /100 | #276 | Tragic 20.0% |
| Immigrants | Barbados | 0.0 /100 | #277 | Tragic 20.0% |
| Immigrants | West Indies | 0.0 /100 | #278 | Tragic 20.0% |
| Bangladeshis | 0.0 /100 | #279 | Tragic 20.0% |
| Central Americans | 0.0 /100 | #280 | Tragic 20.1% |
| Immigrants | Zaire | 0.0 /100 | #281 | Tragic 20.1% |
| Comanche | 0.0 /100 | #282 | Tragic 20.1% |
| Immigrants | Jamaica | 0.0 /100 | #283 | Tragic 20.1% |